Financial Market Research Reports for Forex, COMEX & Crypto
Stay ahead in the markets with real-time Forex, COMEX, and crypto research reports. Get expert trading signals, technical analysis, and accurate forecasts to make confident trading decisions.
Daily Market Overview
Date: 8th May, Friday 2026
Market Headlines & Breaking News
Summary
The dollar slipped across the board as investors grew optimistic about a possible end to the Iran conflict, while the Japanese yen surged to a more than two-month high, increasing speculation of possible intervention from Tokyo authorities.
Overnight Development
The U.S. Dollar Index (DXY) declined 0.3% to 97.993 after touching 97.623, its lowest level since before the February U.S. strikes on Iran. The euro strengthened 0.5% to $1.17535, while GBP/USD advanced 0.4% to $1.35955.
Expert Opinion
Analysts believe improving risk sentiment and optimism surrounding a possible U.S.-Iran agreement continue to pressure the dollar lower.
News Impact
Reports suggest Washington and Tehran are nearing an agreement through mediation efforts, potentially reducing geopolitical tensions and supporting broader market risk appetite.
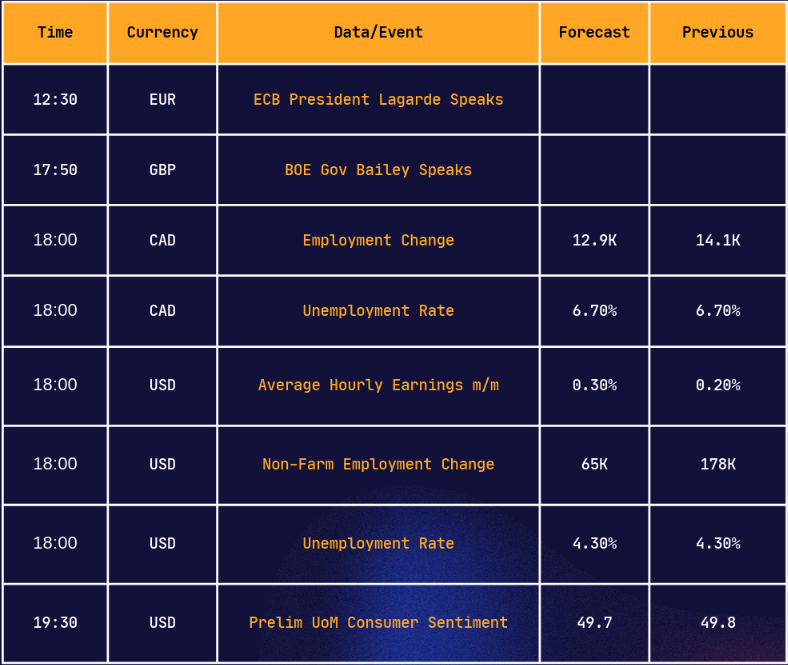
Economic Calendar & Key Events
Forex Market Outlook & Trade Setups
Summary
The Australian and New Zealand dollars traded defensively as renewed Gulf tensions pushed oil prices higher, although both currencies remained close to recent highs.
Overnight Development
AUD/USD traded near $0.7207 after retreating from a four-year high of $0.7277. Market support levels are now seen around $0.7198 and $0.7136.
Expert Opinion
Analysts expect Australia’s budget deficit to narrow due to stronger tax receipts and commodity prices, potentially supporting future fiscal tightening.
News Impact
Rising oil prices continue complicating Australia’s inflation outlook, increasing pressure on policymakers to maintain tighter monetary conditions.
EUR/USD Analysis
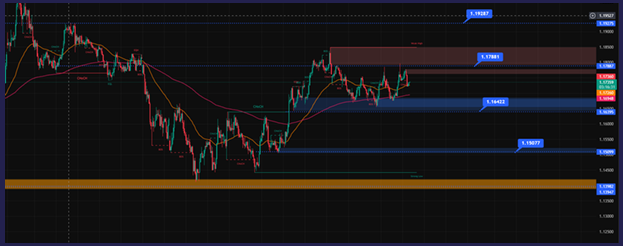
Technical Summary
USD/JPY is currently trading near 156.37, holding above the key 155.50 support zone after a sharp rejection from the 159.90 resistance area.
Data Related Projection
If USD/JPY holds above 155.50, buyers could regain momentum and push price back toward 157.80, followed by a retest of 159.90 resistance.
Indicator Interpretation
Price is currently trading below the short-term moving average, indicating temporary bearish momentum after resistance rejection.
Trigger Points
- Bullish continuation above 157.80 targeting 159.90
- Bearish continuation below 155.50 targeting 153.48
Technical Confirmation
- Daily close above 157.80 confirms recovery momentum
- Daily close below 155.50 confirms deeper bearish correction
Daily Pivot
157.20
USD/JPY Analysis
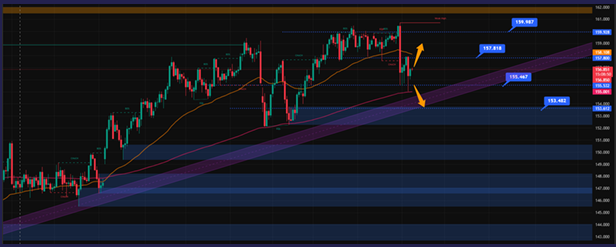
Technical Summary
USD/JPY trades near 156.85 after rejecting from the 159.90 resistance area while continuing to hold above critical trendline support.
Data Related Projection
Recovery above 157.80 may push the pair toward 159.90 again, while a break below 155.50 could expose downside targets near 153.48.
Indicator Interpretation
Short-term momentum remains corrective, though the long-term bullish structure remains intact.
Trigger Points
- Bullish trigger: Above 157.80
- Bearish trigger: Below 155.50
Technical Confirmation
A daily close above 157.80 confirms bullish recovery momentum, while a close below 155.50 confirms deeper correction pressure.
Daily Pivot
157.10
COMEX Market Analysis (Gold, Oil)
Summary
Gold maintained a positive tone for the third consecutive session, holding above the $4,700 level amid continued weakness in the U.S. dollar.
Overnight Development
Markets remain focused on geopolitical tensions and possible developments surrounding a U.S.-Iran peace agreement.
Expert Opinion
Traders are awaiting key U.S. economic data including jobless claims and Non-Farm Payrolls for directional confirmation.
News Impact
Diminishing expectations of aggressive Federal Reserve tightening continue supporting gold prices
Gold Price Analysis
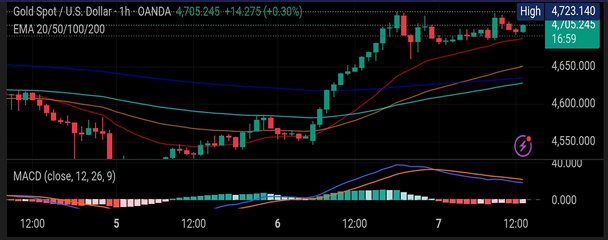
Technical Summary
Gold remains supported after breaking above the 200-hour EMA and key Fibonacci retracement levels.
Data Related Projection
Strong labor market data and Fed rate expectations may limit further upside in gold despite ongoing dollar weakness.
Indicator Interpretation
RSI near 65 suggests positive momentum while MACD remains slightly negative, indicating caution near resistance.
Trigger Points
Immediate resistance stands near $4,741 followed by $4,807.
Technical Confirmation
Bullish continuation remains favored while price sustains above the 4600 structural support region.
Daily Pivot
4655
Crude Oil Forecast
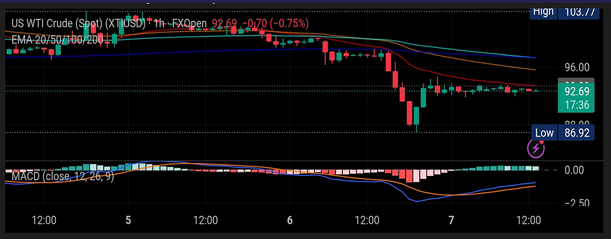
Technical Summary
Crude oil remains volatile amid geopolitical developments and supply concerns tied to the Strait of Hormuz and OPEC+ policy.
Data Related Projection
Sustained movement above 94.20 may extend gains toward 96.50 and 98.80, while a break below 91.00 could trigger renewed selling pressure.
Indicator Interpretation
Price remains above the 50 EMA and the 200 EMA continues trending upward, supporting medium-term bullish sentiment.
Trigger Points
- Bullish trigger: Above 94.20
- Bearish trigger: Below 91.00
Technical Confirmation
A strong daily close above resistance supports bullish continuation while downside breaks may invite corrective pressure.
Daily Pivot
95.85
Global Indices Outlook
Summary
U.S. equities traded within a narrow range as investors awaited additional inflation and labor-market data.
Overnight Development
Global markets remained mixed overnight while U.S. futures traded slightly lower amid elevated bond yields.
Expert Opinion
Analysts believe institutional investors are rotating between sectors rather than reducing overall equity exposure.
News Impact
Higher Treasury yields continue pressuring growth and semiconductor stocks, limiting upside momentum in major indices.
US 30 Analysis
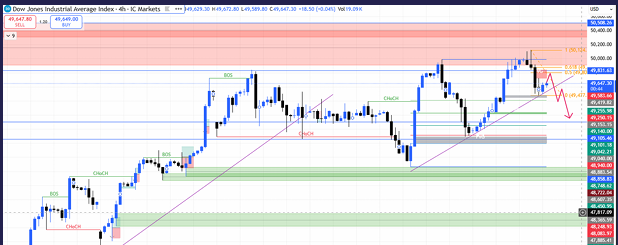
Technical Summary
US30 remains within a broader bullish structure but is currently consolidating below major resistance near 50,000.
Data Related Projection
Holding above the 49,250 support zone may support bullish continuation toward 50,500.
Indicator Interpretation
The broader trend remains bullish with higher highs and higher lows, although momentum is slowing near resistance.
Trigger Points
- Bullish trigger: Above 49,850
- Bearish trigger: Below 49,250
Technical Confirmation
Bullish confirmation requires strong acceptance above 49,850, while bearish confirmation comes below 49,250 support.
Daily Pivot
49,500
Risk Disclaimer & Trading Policy
DISCLAIMER |
Carlos and Company respect and values the Right to Policy of each and every individual. We are esteemed by the relationship and by becoming our clients; you have a promise from our side that we shall remain loyal to all our clients and non-clients whose information resides with us. This Privacy Policy of Carlos and Company applies to the current clients as well as former clients. Below are the word-by-word credentials of our Privacy Policy:
- Your information, whether public or private, will not be sold, rented, exchanged, transferred or given to any company or individual for any reason without your consent
- The only use we will be bringing to your information will be for providing the services to you for which you have subscribed to us.
- Your information given to us represents your identity with us. If any changes are brought in any of the fields of which you have provided us the information, you shall bring it to our notice by either calling us or dropping a mail to us.
- In addition to the service provided to you, your information (mobile number, E-mail ID etc.) can be brought in use for sending you newsletters, surveys, contest information, or information about any new services of the company, which will be for your benefit, and while subscribing for our services, you agree that Carlos and Company has the right to do so
- By subscribing to our services, you consent to our Privacy Policy and Terms of Use.
- Carlos and Company does not guarantee nor is responsible in any which way, for the trade execution of our recommendations; this is the sole responsibility of the client.
- Due to the market’s volatile nature, the trader may/ may not get appropriate opportunity to execute the trades at the mentioned prices and Carlos and Company holds no liability for any profit/ loss incurred whatsoever in this case..
- It is the responsibility of the client to view the report timely from our Premium member section on our website: www.carlosandcompany.com and the same will also be mailed to this registered email id.
- Carlos and Company does not hold any liability or responsibility of delay in mail delivery of reports, as this depends on our mail service provider’s network infrastructure