
Fair Value Gap Trading Strategy for Forex and XAUUSD
A fair value gap (FVG) is a three-candle price pattern in which the first and third candles leave a range between their wicks after a sharp move. A fair value gap trading strategy marks that range, waits for price to revisit it, and uses a defined entry trigger, stop-loss and target. Some gaps never fill.
An FVG can appear after a liquidity sweep, such as when EUR/USD briefly moves below a recent low and then rallies. The sweep describes what happened at the low. The gap marks the range you can watch if price pulls back. The examples below show how to use that distinction to plan a trade and when to pass.
What Is a Fair Value Gap in Trading?
A fair value gap is the space between the wicks of the first and third candles in a three-candle sequence. In Smart Money Concepts (SMC) and ICT terminology, the middle candle often shows displacement, a sharp move in one direction. The term fair value is a name for the pattern. It represents a price range on your chart, so it can vary by timeframe and quote feed.

For example, a large green candle may look like a bullish imbalance while it is forming. If the third candle trades back into the first candle’s range before closing, the gap disappears under the wick-based rule. Wait for all three candles to close before you draw the zone.
Bullish vs Bearish Fair Value Gap
| FVG type | What to look for | Where to draw the zone |
|---|---|---|
| Bullish fair value gap | Candle 3’s low is above candle 1’s high | From candle 1’s high to candle 3’s low |
| Bearish fair value gap | Candle 3’s high is below candle 1’s low | From candle 3’s high to candle 1’s low |
Use wick prices for both boundaries. If the two boundary prices are equal, the gap has zero width. The midpoint can help you record how far a pullback travelled. Decide in advance whether your rules count a touch of the near edge, a midpoint test or a move to the far edge as a fill. Each definition can produce different test results.
How to Trade Fair Value Gaps
1. Set the timeframe and mark market structure
Start with a one-hour chart for context and a 15-minute chart for the setup. Mark the latest clear swing high and low on the one-hour chart. For this continuation setup, look for a bullish FVG after a 15-minute close above a prior swing high in a broader uptrend. In a downtrend, look for a bearish FVG after a close below a prior swing low. Skip setups when the broader direction is unclear.
2. Define the entry before the retest
Use the first return to the zone after candle 3 closes. For a confirmation entry, wait for a retest candle to close back above the upper edge for a long or below the lower edge for a short. Use the next available quote to estimate the entry. Cancel the setup if a candle closes beyond the opposite edge before entry.
A separate approach uses a limit order at the midpoint, sometimes called consequent encroachment in ICT terminology. Calculate it by averaging the upper and lower boundaries. Test midpoint and confirmation entries separately because they produce different fills, stop distances and missed trades.
3. Set the stop, position size and target
For a long, place the hypothetical stop below the swing low that supports the setup. For a short, use the corresponding swing high. A confirmed setup can still fail. Plan for the possibility that a stop executes at a worse price in fast conditions.
Choose a target from visible structure, such as the next swing high for a long or swing low for a short. Compare the distance to that target with the stop distance. This example strategy skips entries with less than twice the initial price risk available before costs. Spreads, commissions and slippage can reduce the realized reward-to-risk ratio.
Fair Value Gap Examples for Forex and XAUUSD
The prices below are hypothetical. They show how to calculate risk and spot a setup that fails the entry rules.
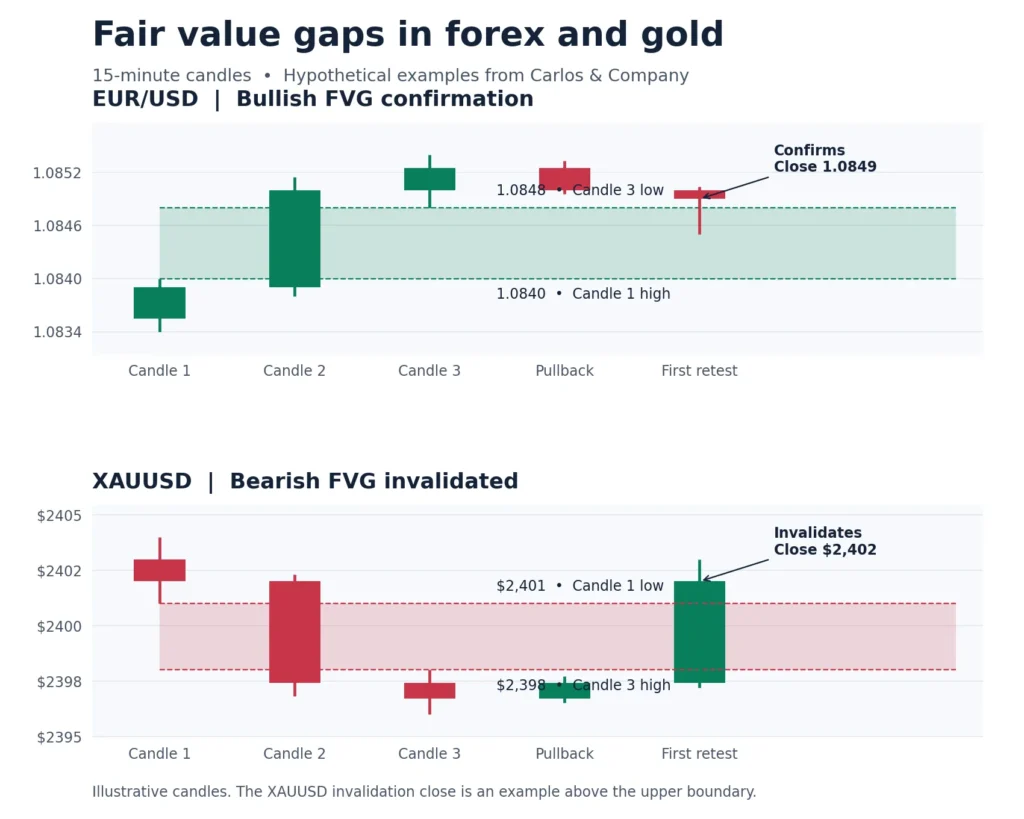
EUR/USD bullish FVG and confirmation entry
On a 15-minute EUR/USD chart, candle 2 closes above a prior swing high. Candle 1’s high is 1.0840 and candle 3’s low is 1.0848, so the zone spans those two prices. On the first retest, price dips to 1.0845 and the candle closes at 1.0849. That close clears the upper edge and meets the confirmation rule.
Suppose the next available buy quote is 1.0850. A stop at 1.0838 gives 12 pips of planned price risk. A prior high at 1.0874 offers 24 pips of potential reward, or 2:1 before costs. If the buy quote rises to 1.0854, the same stop and target give 16 pips of risk and 20 pips of potential reward. The entry then fails the 2:1 rule.
XAUUSD bearish FVG and failed retest
On a 15-minute gold chart, candle 1’s low is $2,401 and candle 3’s high is $2,398. The bearish gap runs from $2,398 to $2,401. For this example, review XAUUSD trading hours and log which session produced the gap. Use the same session window when comparing setups in chart replay.
Suppose gold retests the area, then closes below $2,398. A hypothetical sell at $2,397, stop at $2,403 and target at $2,385 give $6 of risk and $12 of potential reward per ounce before costs. If your broker specifies 100 ounces per standard lot and offers a 0.01-lot increment, 0.01 lot represents one ounce. The planned price risk at that size is $6. Use the XAUUSD lot size calculation with your broker’s contract specifications and lot increments.
If the first retest instead closes above $2,401, cancel the short under the stated rules. Also check whether the chart displays bid, ask or midpoint prices. A short closes with a buy, so the ask can reach the stop even when a bid-only chart appears to stay below it.
How to Test an FVG Setup in Chart Replay
Write down the timeframe, session, swing definition, entry rule and stop before starting. Advance one candle at a time and mark each eligible zone only after candle 3 closes. Record whether price touches the near edge, reaches the midpoint or crosses the far edge. These are three different outcomes. A touch can occur without a valid entry.
Log skipped setups, missed fills, wins, losses and estimated costs. If a single historical candle reaches both the stop and the target, use lower-timeframe data to check which came first or flag the result as unresolved. Review EUR/USD and XAUUSD separately so differences in execution are visible.
Conclusion
A fair value gap gives you a zone to watch. A complete setup also needs a qualifying retest, an executable entry, a stop tied to market structure and a target with enough room after costs. Use chart replay to compare entries and apply trading expectancy after costs to assess what the full set of trades delivered.
Here's a quick look at what you'll read
No. Price can continue away from the zone, touch part of it or pass all the way through. Define a full fill as reaching the far edge and set an observation window, such as the next 20 candles, before you measure fill rates.
An inverse fair value gap (IFVG) is a breached FVG watched for a possible role reversal. For example, after price closes below a bullish gap, some traders watch for resistance if price later returns from below. The breach and the retest are separate events.
You can mark the zones manually from the three candle highs and lows. An FVG indicator can speed up screening. Check whether it waits for candle 3 to close, uses wick or body prices and removes gaps on a touch or a full fill.
There is no universal best timeframe. A one-hour context chart with 15-minute entries is a starting point for testing. Compare timeframes with the same rules and check how much of the typical stop distance is taken up by trading costs.
