Explore The Secrets of 6 Different Bar Chart Trading Groups
6 different bar chart trading groups help you identify key trends, improve your strategies, and boost trading success.
Market Structures
I first read about the Market Structures concept from Dr. Ron Lockhart. Then I read more detailed Market Structures work from Michael Jardine’s book, Fibonacci Trading. The Market Structure concept is simple, yet a very powerful structuring concept. Markets have structures and traders miss most cues as they are constantly hunting some pattern, momentum, oscillator or some Zen-type signals. Market Structure formation is a price phenomenon occurring at major turns.

Prices start with a wave (lets say Up) and it ends at some point and then there is a down-wave, and it ends some time and then begins another up-wave. These wave formations start with the Market Structures. Market Structure Low (MSL) and Market Structure High (MSH) formation is continuous and is repetitive at every wave begin and at every wave end.
Market Structures form in all markets, in all time-frames and in all instruments. They fail and re-fail, form and re-form. Market Structure is a concept pattern. It needs other indicators, support/resistance levels, triggers to confirm the theory and its works.
Market Structures are well explained with Candlestick charts. Market Structure Low (MSL) is explained with three candle pattern. A new low, lower low, higher low of CLOSE. Please see the word in BOLD, MSL is based on close values not lows or highs. A MSL based long is triggered when prices close above the highest close value. A stop is being placed below the low of the MSL to protect the trade.
Technicians have developed various methods of representing market data on charts. The most extensively used charts are bar charts, line charts, candlestick charts and point & figure charts. There are many other variations like Kagi, Renko and Range bar charts. In this section, I will attempt to address the basic charts and their usage.

The example above illustrates a Market Structure trading formation on Russell Emini futures (ER2) weekly chart. In April 2002, ER2 formed a Market Structure high at 560 level. A short trading signal was triggered the following week at 540 level. A stop is placed above the high of MSH at 565. A profit level for MSH trading is set either at a previous swing low or MSL level, or until another MSL is formed to reverse its trend direction. A similar trading opportunity for MSH is presented again in December 2002. A MSL trading opportunity is shown in April 2003 around 420 levels. A stop loss is set at MSL low (at 390).
Three Bar Groups
Chart formations in Technical analysis require a group of bars to derive a pattern. Sometimes a single bar or two bars can show great patterns, but as a group, 3-bar series groups provide reliable patterns or confirmations for other major developing patterns. These groups of bars are called “key reversal” bars. This 3-bar group may also consist of well known two-bar reversals or a single bar patterns within inside this group. Most of these 3-bar groups are part of a “fractal” formations or part of “market structures” where a prevailing trend showing signs of pausing or reversal of current trends. Bars with exhaustion price-action, “narrow range (with inside-days)” or “spike with ledges” are some of the 3-bar group pattern examples. 3-bar group pattern formations near key support and resistance levels or near key moving averages (50 EMA, 200 SMA) offer great potential trade setups. Within the 3-Bar Groups, intra-bar relations like close and open values relative to other bar close and open values and how they are formed could give signals of continuation or reversal of trends. Gaps within the 3-bar patterns also have significance.
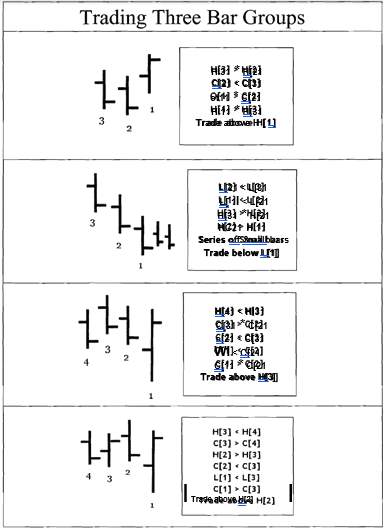
Three Bar Pattern groups as the name suggests, will have three continuous bars. It can be in any time-frame or in any market instrument. A 3-bar group pattern is defined using the three bar’s inter-bar Open, High, Low, Close relationships with each other. In my view, Three Bar patterns are relatively short trade setups and should be traded using other indicators. They are more effective as reversals near the end of prolonged trends than in the middle of the trends. When markets making new highs and showing a series of signs of pausing or reversals, 3-bar patterns are more reliable than 3-bars formed in the middle of the trend. Two out of three 3-Bar Groups may be successful but the concept also applies to bigger structures with three continuous major “swing highs” and three continuous major “swing lows”. When trading three-bar groups, look for the third bars’ range. When the range of the third bar is greater than prior two bars, it tends to produce more reliable results.

One of the 3-Bar Groups (Market Structures) is discussed in detail in this book and here I present few of my favorite patterns that 1 trade.
Trading 3-Bar Groups
All the 3-Bar group patterns listed below have trade-setups. Most of these patterns are short-term based and targets are usually at a major “swing h i g h or major “swing low” based on the pattern setup. Stop orders should be placed to protect the trade within the 3-bar groups. Three bar group patterns fail when significant support or resistance is traded against the trade setup. When trading an upside 3-bar group, place a stop order below the lowest low of the three bars. When trading a downside 3-bar group, place a stop order above the highest high of the three bars
Matching Highs & Lows Pattern
Matching Highs and Matching Lows patterns occur at market bottoms and tops. Prices form key support and resistance areas at certain price ranges, and attempt to break these levels for at least 3 bars in a row. When the prices fail to break these levels, they form “matching lows” and matching high patterns for a minimum of 3 bars, and these “matching highs” or “matching lows” may signal a potential trend reversals. These patterns are more effective in daily and weekly charts. Intra-day tick charts with higher tick counts or time-frames are used when finding reliable matching highllow patterns.
Trade: Trades are taken in the opposite direction prior to the matching highsllows pattern. After a “matching lows” pattern, a “long” trade may be entered above the high of the breakout bar. For a matching highs pattern, a “short” trade is entered below the low of the breakdown bar.
Stop: Place a “stop” order below the low of the pattern for a “matching lows” pattern. For a matching highs pattern, place a “stop” order above the high of the pattern.
Target: Targets are placed from the trade entry in multiples of length of the breakout bar. For a long entry, place the first target at the length of the breakout bar above the entry, and the second target is set at twice the length of the breakout bar above the entry. For short entry, place the first target at length of the breakout bar below the entry level, and the second target is set at twice the length of breakout bar below the entry.
Trading Matching Highs Pattern
The example above illustrates a “Matching Highs” pattern from the Russell Emini fitures (ER2) 6 10 tick chart. On March 26, 2007, ER2 rallied most of the day to form a top at the 815.5 area. Late in the afternoon, Russell formed a Matching Highs pattern for a series of bars to suggest a potential short trade.
- Enter a “short” trade below the low of the breakdown bar at 813.6.
- The length of the breakdown bar is measured at 1.6 points.
- Set a profit target at 812 (length of the breakdown bar) and 810.4.
- Place a “stop” order above the high of the pattern at 815.5.

Trading Matching Low Pattern
The chart above illustrates an example of a Matching Lows pattern from the Russell Emini futures (ER2) 610 tick chart. On April 5,2007, during the morning trading, ER2 formed a matching lows pattern at 815 area to suggest a potential long trade. Wait for a breakout bar to confirm higher highs before placing a trade.
- Enter a “long” trade one-tick above the breakout bar’s high at 8 16.3.
- The length of the breakout bar is 0.8 points.
- Set targets at 817.1 (length of the bar) and 8 18.
- Place a “stop” order below the low of the matching low pattern at 815.1.

N Bar Rallies/Declines
Stocks making new Highs and new Lows with high volume attract momentum players. Momentum players continue to push these stocks until the supply or demand diminishes. But as in any rally or decline, these trends stop and reverse. The prices become oversold and overbought creating a condition for exhaustion of the supply and demand. Hence, if these prices reverse (could be brief), an opportunity is presented. Traders who wait and take advantage of these counter-trades are daring and risky, but they do present a healthy risklreward profit ratio. The popular trading strategy is to wait for the trend to stop and reverse The n-Bar RallyIDecline setup presents a technique of trading these counter-trend setups.
Trade: The n-Bar RalliesIDeclines build up on based on new-highs and new-lows setups. Prices must make at least a 21-bar new high and new-low, and at least 3 new highs or 3 new lows successively-the higher the number, the better the pattern result. After an exhaustion move, enter a long one tick or 5 cents above the last falling bar’s high, or enter a short one tick below the last rising bar’s low.
Stop: Place a “stop” order one tick below the low of the falling bar in a long setup, or place a “stop” order one tick above the high of the rising bar in a short setup.
Target: Place a target 62% to 100% of the entire range of n-bar RallyIDeclines for long or short setups. The other targets could be a major “swing high” or major “swing low” prior to the n-Bar setup.
Tradin n Bar Declines
The example above illustrates an n-Bar Decline pattern from the Russell 2000 Emini chart. On May 10, 2007, ER2 sold off in the pre-afternoon session and started to make new lows around 12pm. Six new lows bars were traded before a reversal bar triggered a trad above the previous bar’s high. This scenario presented a trade long in the downtrend.
- Enter a “long” trade one tick above the previous bar’s high at 822.7.
- Place a “stop” order below the low of the n-Bar decline at 821.6.
- Target between 62% and 100% of the n-Bar decline range from 824.8 to 826.

Trading n-Bar Rally
The example above illustrates an n-Bar Rally setup from the Chevron weekly chart. From January to March of 2005, Chevron’s stock rose from $52 to $63. Chevron made a series of higher-high prices to complete n-Bar High pattern. At the beginning of April, 2005, Chevron stopped making new highs and presented a potential short setup.
- Enter a “short” trade below the low of the last higher-high bar at $59.70.
- Place a “stop” order above the high of the last n-Bar setup at $63.25.
- Place the target from 62% to 100% of range of the n-Bar setup from $55 to $53.

Seven-Day Narrow Range & Inside Bar
Toby Crabel popularized a trading pattern called NR7ID with ORB in his book, Day Trading with Short Term Price Patterns and Opening Range Breakout.
7-Day Narrow Range (NR7): NR7 is defined as the daily range which is narrower than the prior 6-Day range.
Inside Day (ID): Inside Day is defined as a trading day that has range which is completely encompassed by the previous days’ range. The prior day’s high is higher than the current days’ high and the prior day’s low is lower than current days low.
Opening Range Breakout (ORB): Is a trade executed when prices trade a predetermined amount above or below the opening range. The predetermined range is calculated as the 10-bar average distance between open to high and open to low.
Trade: Enter a trade after the NR7ID in the direction of the breakout. Enter a long trade on breakout at the ORB value above the high. For a short trade, enter a short trade on breakdown at the ORB value below the Low.
Stop: For breakout trades, place a stop order at (low-ORB). For breakdown trades, place a stop order at (high + ORB).
Target: “NR7ID with ORB” is primarily a trade entry technique and the targets are set at prior “swing highs” and prior “swing lows” or at key resistance and support areas.
Trading NR7ID with ORB Pattern
The chart above illustrates a series of NR7ID patterns (shown in circles) from the Russell 2000 (ER2) 610 tick chart. An ORB is computed for a trade entry on the charts. Trades are only initiated in the direction of the breakdown or breakout above the high by ORB (at high + ORB), or below the low by ORB at (low – ORB). A stop order is placed in the opposite direction of the trade. As an example, for a breakout from NR7ID, a stop is placed at (low-ORB) and for a short trade, a stop is placed at (high + ORB).

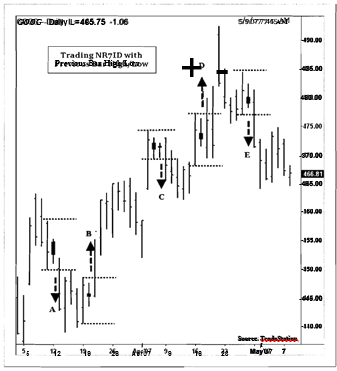
Day Trading NR7ID with Previous bar HighILows
The chart above illustrates an example of a NR7ID pattern with previous bar highsllow trading from the GOOG daily chart. An efficient way to trade NR7ID bars is to use the previous bar high, or the previous bar low as the trigger points. Trade stops are placed on the other end of NR7ID against the trade. Usually these trades are very short-term and should be closed within 1-3 bars (days). In the chart above, on March 12th, GOOG formed a NR7ID pattern at A. A trade setup is to enter a long trade on the next day if the price trades 10 cents above the previous days high or enter a short if the price trades 10 cents below the previous days’ low. Trades at B and D are long trades. Trades at C and E are short trades.
Seven Day Wide-Range and Outside Day Pattern (WR70D)
A 7-day Wide Range bar is formed when a current bar has the widest range in the last 7 bars. An outside bar develops when the low of the current bar is lower than the previous bar and the current high is higher than the previous bar. Trades are only entered in the direction of the current trend.
Wide Range bars forming at the start of a trend or at key reversal levels could signal strong bullish and bearish trends. If Wide-Range bars are forming out of a consolidation range, they signal price continuation in the direction of breakouts. And Wide-Range bars forming at the end of the rallies and sell-offs, the bars may be signaling exhaustion and potential trend reversals.
Trade: Wait for WR70D to form in the current up or down trend. In an uptrend, trade only “long” one tick above the high of the WR70D bar. In down trends, trade only “short” one tick below the low of the WR70D bar.
Stop: Place a “stop” order one-tick below the low of the WR70D bar (for breakouts). Place a “stop” order one-tick above the high of the WR70D bar (for breakdowns).
Target: Set targets of 50% to 100% of the WR70D range from the breakout or breakdowns levels.
Trading WR70D Pattern
The example above illustrates a WR70D pattern from the Russell Emini ( E M ) 30 minute chart. Please note the Wide Range bar inset. Wide Range bars are only traded in the breakout direction of the trends. A 7-day Wide Range bar signals trend shift. Long trades are initiated high above the Wide Range bar. In the example above, bars A, B and C are in down-trend and trades are only taken from downside. Bar D is formed in uptrend and trade is only taken in the upside direction.
- Enter a “long” trade one-tick above the high of the WR70D bar.
- Place a “stop” order one-tick below the low of the WR70D bar.
- Place targets from 50% to 100% of the WR70D range from the breakout level.

Trading WR7OD Pattern
The example above shows a 7-day Wide-Range with outside bar formations from the S&P futures 610 tick chart. WR70D bars signal the exhaustion and trend reversals. Trading WR70D coupled with any confirmation indicators, or other market patterns, could be profitable. The first WR70D bar was formed around lunch time in an uptrend. A “long” trade can be entered above the high of the WR70D bar at
1. The second WR70D bar is formed at around 1:30 pm in downtrend. A downside trade is triggered below the low of the Bar
2. The third WR70D bar is a trend reversal bar and trade is triggered above the high of the WR70D bar. The fourth WR70D bar is a continuation bar similar to the third WR70D bar.