Dual Candlestick Patterns Every Forex Trader Should Know Before Taking a Signal
Candlestick patterns are one of the most important tools in forex trading. They help traders understand market direction, buyer strength, seller pressure, and possible reversal zones. Whether you trade forex, gold, crypto, or indices, reading a candlestick chart can help you make better trading decisions.
But one candle is not always enough.
This is why dual candlestick patterns are useful. These patterns are formed by two candles and give traders a clearer view of market sentiment. When you read the market candle by candle, you can better understand whether a trading signal has strong confirmation or whether it should be avoided.
For traders who follow forex signals, dual candlestick patterns are especially important. A signal may give you an entry, stop loss, and take profit, but you still need to check whether the chart supports the trade.
In this blog, we will explain the most important dual candlestick patterns every forex trader should know before taking a signal.
What Are Dual Candlestick Patterns?
Dual candlestick patterns are chart formations created by two candles. These candles show how buyers and sellers reacted during two trading periods.
A single candlestick shows the open, high, low, and close price. But two candles together can show a change in market behavior.
For example, if the first candle is bearish and the second candle is strongly bullish, it may show that buyers are taking control. If the first candle is bullish and the second candle is strongly bearish, it may show that sellers are entering the market.
Dual candlestick patterns are commonly used in:
- Forex trading
- Gold/XAUUSD trading
- Intraday trading
- Price action trading
- Signal confirmation
- Technical analysis
Why Dual Candlestick Patterns Matter Before Taking a Signal
Many beginner traders follow buy or sell signals without checking the chart. This is a common mistake.
Before taking any forex signal, you should ask:
- Is the signal supported by price action?
- Is the candle closing strongly?
- Is price near support or resistance?
- Is the stop loss placed correctly?
- Is the risk-reward ratio good?
A candlestick graph can help you answer these questions. It does not guarantee profit, but it helps you avoid weak entries.
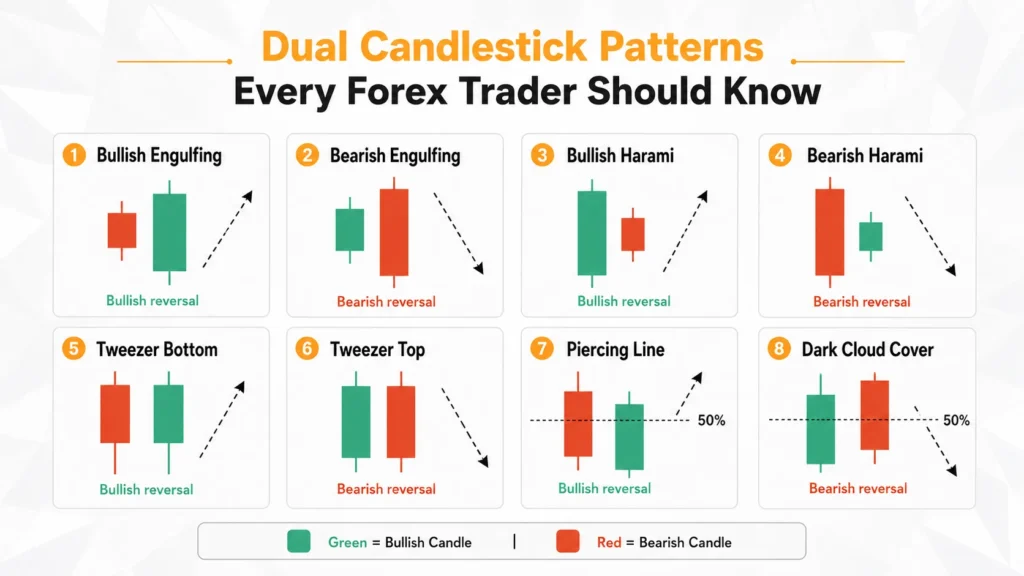
Bullish Engulfing Pattern
The bullish engulfing pattern is one of the strongest bullish patterns in forex trading.
It forms when:
- The first candle is bearish.
- The second candle is bullish.
- The second candle covers the body of the first candle.
This pattern shows that sellers were active first, but buyers entered with stronger momentum.
What It Means
A bullish engulfing pattern can signal a possible upward reversal. It is more powerful when it appears near:
- Support level
- Demand zone
- Previous swing low
- Oversold area
- Trendline support
How to Use It Before Taking a Signal
Before taking a buy signal, check whether the bullish candlestick forms near support. If the second candle closes strongly and the stop loss can be placed below support, the setup becomes more reliable.
Example:
Signal Detail | Example |
Pair | EUR/USD |
Signal | Buy |
Entry | 1.0850 |
Stop Loss | 1.0815 |
Take Profit | 1.0920 |
If this buy signal appears after a bullish engulfing pattern near support, it may have stronger confirmation.
Bearish Engulfing Pattern
The bearish engulfing pattern is the opposite of the bullish engulfing pattern.
It forms when:
- The first candle is bullish.
- The second candle is bearish.
- The second candle covers the body of the first candle.
This pattern shows that buyers were active first, but sellers entered strongly and pushed the price down.
What It Means
A bearish engulfing pattern can signal a possible downward reversal. It is stronger when it appears near:
- Resistance level
- Supply zone
- Previous swing high
- Overbought area
- Trendline resistance
How to Use It Before Taking a Signal
Before taking a sell signal, check whether the bearish engulfing pattern forms near resistance. If price rejects the level and the bearish candle closes strongly, the sell setup may be stronger.
A good stop loss is usually placed above the resistance or above the high of the engulfing candle.
Tweezer Bottom Pattern
The tweezer bottom is a bullish reversal pattern. It forms when two candles have almost the same low.
This means price tried to move lower twice but failed. It shows that sellers may be losing strength and buyers may be entering the market.
What It Means
A tweezer bottom often appears after a downtrend. It becomes stronger when it forms near a support zone.
Traders use this pattern to identify possible buy opportunities.
How to Use It Before Taking a Signal
Before taking a buy signal, check:
- Are both candle lows near the same level?
- Is the second candle bullish?
- Is price near support?
- Can the stop loss be placed below the lows?
If the answer is yes, the signal may be stronger.
Tweezer Top Pattern
The tweezer top is a bearish reversal pattern. It forms when two candles have almost the same high.
This means price tried to move higher twice but failed. It shows that buyers may be losing strength and sellers may be entering.
What It Means
A tweezer top often appears after an uptrend. It is stronger when it forms near resistance.
Traders use this pattern to confirm possible sell opportunities.
How to Use It Before Taking a Signal
Before taking a sell signal, check:
- Are both candle highs almost equal?
- Is the second candle bearish?
- Is price near resistance?
- Can the stop loss be placed above the highs?
If the pattern appears near a strong resistance level, it may help confirm the sell signal.
Piercing Pattern
The piercing pattern is a bullish dual candlestick pattern. It usually appears after a downward move.
It forms when:
- The first candle is bearish.
- The second candle opens lower.
- The second candle closes above the middle of the first candle.
This pattern shows that sellers pushed the price down, but buyers entered and recovered much of the move.
How to Use It
The piercing pattern is useful when looking for buy opportunities near support. It becomes stronger when the second candle closes with a strong bullish body.
Before entering a buy trade, wait for confirmation from the next candle or a break above a small resistance level.
Dark Cloud Cover Pattern
The dark cloud cover pattern is a bearish dual candlestick pattern. It usually appears after an upward move.
It forms when:
- The first candle is bullish.
- The second candle opens higher.
- The second candle closes below the middle of the first candle.
This pattern shows that buyers pushed the price up, but sellers entered and pushed it back down.
How to Use It
Dark cloud cover is more reliable near resistance. If a sell signal appears after this pattern, traders may use it as confirmation.
However, do not enter only because the pattern appears. Always check support, resistance, trend direction, and risk-reward ratio.
Double Top Candlestick Pattern
The double top candlestick pattern is a bearish reversal setup. It forms when price reaches a high, pulls back, then rises again to a similar high and fails.
This pattern shows that buyers tried twice to break resistance but could not continue higher.
How to Identify It
A double top includes:
- First high
- Pullback
- Second high near the same level
- Neckline support
- Break below neckline
How to Use It Before Taking a Signal
Before taking a sell signal, check whether price has failed twice near resistance. The signal becomes stronger if price breaks below the neckline with bearish momentum.
The stop loss is usually placed above the second top. The take profit can be planned based on the distance between the top and neckline.
Bullish vs Bearish Dual Candlestick Patterns
| Pattern | Type | Best Area | Signal Direction |
|---|---|---|---|
| Bullish Engulfing | Bullish | Support | Buy |
| Piercing Pattern | Bullish | Support | Buy |
| Tweezer Bottom | Bullish | Support | Buy |
| Bearish Engulfing | Bearish | Resistance | Sell |
| Dark Cloud Cover | Bearish | Resistance | Sell |
| Tweezer Top | Bearish | Resistance | Sell |
| Double Top | Bearish | Resistance | Sell |
How to Confirm Candlestick Patterns Before Trading
Candlestick patterns should not be used alone. To improve accuracy, combine them with:
1. Support and Resistance
A pattern near support or resistance is more useful than a pattern in the middle of the chart.
2. Trend Direction
A bullish pattern in an uptrend is usually stronger than a bullish pattern against a strong downtrend.
3. Stop Loss
Every trade should have a clear stop loss. If you do not know where to place your stop loss, avoid the trade.
4. Risk-Reward Ratio
Do not take trades with poor risk-reward. A good setup should offer more reward than risk.
5. Signal Confirmation
If you follow forex signals, use candlestick patterns to confirm whether the signal makes sense.
Common Mistakes Traders Make
Many traders lose money because they trade candlestick patterns without confirmation.
Avoid these mistakes:
- Trading every pattern you see
- Ignoring support and resistance
- Entering before the candle closes
- Trading without stop loss
- Following signals blindly
- Using patterns on very noisy timeframes only
The goal is not to trade more. The goal is to trade better.
Final Thoughts
Dual candlestick patterns help forex traders understand market sentiment before entering a trade. Patterns like bullish engulfing, bearish engulfing, tweezer top, tweezer bottom, piercing pattern, dark cloud cover, and double top candlestick pattern can help confirm buy and sell signals.
However, candlestick patterns are not magic. They should be used with support and resistance, trend analysis, stop loss, take profit, and risk management.
If you follow forex signals, learning these patterns can help you decide whether a signal has strong confirmation or whether it is better to wait.
Want expert help before taking your next forex signal? Request a free demo signal from Carlos & Company and learn how professional traders use entry, stop loss, and take profit with proper chart confirmation.
Here's a quick look at what you'll read
Dual candlestick patterns are trading patterns formed by two candles that help traders understand possible market reversals or continuation signals.
Bullish engulfing and bearish engulfing are among the most commonly used dual candlestick patterns in forex trading.
No. Candlestick patterns cannot guarantee profit. They should be used with trend analysis, support and resistance, stop loss, and risk management.
Yes. Candlestick patterns can help confirm whether a forex signal is supported by price action.