Candlesticks Explained: Types, Pros & Cons
The technical analysis tools can assist you in planning and executing your trades. You can identify potential buy and sell opportunities with the right knowledge of candlesticks.
Being a leading financial consultant, Carlos and Company can assist you in interpreting the candlestick. In this blog, we will discuss diverse types of candlesticks and their meaning, as well as the pros and cons of candlestick trading. So, let’s get started:
What are Candlesticks?
Candlesticks are technical analysis tools that are used to visualize the price movements of financial assets over a specific period on trading charts.
A candlestick forms a candle-type structure on a chart to replicate the price fluctuations. They originated from Japan and were used for rice trading during the initial years. Thus, they are also popularly known as Japanese Candlesticks in the trading world.

Here's a quick look at what you'll read
Candlestick trading involves using candlestick chart patterns to analyze price movements and make trading decisions.
The 3 candle rule refers to a trading setup where traders wait for three consecutive candlesticks to confirm a trend or reversal before entering a trade.
The best candlestick pattern varies by strategy, but popular ones include the engulfing pattern, doji, and pin bar for their reliability in signaling reversals.
Yes, professional traders often use candlestick patterns alongside other technical indicators to enhance their market analysis.
How to Read the Candlesticks
When using the candlesticks trading strategy, effectively interpreting them is a must. You can do so when you have clear basics. For detailed study explore our valuable candlestick pattern PDFs and for brief overview refers to the below key components:
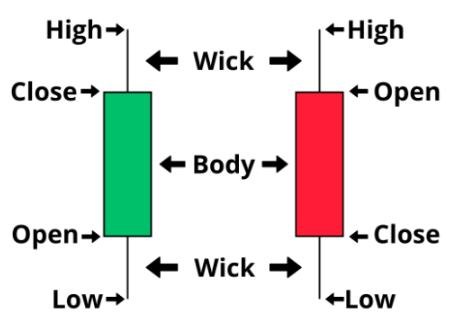
Body
In the above diagram, the red and green rectangular portion is defined as the body of the candlesticks. The upper and lower portion of candlesticks represents an asset’s opening and closing price over a period. Long bodies represent a strong bearish or bullish trend, while short bodies represent indecision in the market.
Wicks
Wicks, also known as shadows, represent the highest and lowest prices over a period. The upper wicks and lower wicks represent the highs and lows.
Color
A candlestick color plays a crucial role in determining the overall trend. A green or white candle is bullish, while a red or black candle is bearish.
Opening and Closing prices
In a bullish candle, the top shows the closing price, and the bottom shows the opening price of a period. Meanwhile, in the bearish candle, the top shows the opening price, and the bottom shows the closing price of a period.

Top 8 Candlestick Patterns in Trading
Doji
Doji is a single candlestick chart pattern that looks similar to a plus symbol. It appears when there is little difference between the opening and closing prices. It has a small body with an upper and lower shadow of similar sizes. The candle indicates indecision in the market.
Engulfing
Engulfing is a pattern consisting of two candles where the first candle is small and the second candle is large. As the next candle engulfs the first candle, the pattern is called engulfing.
A bullish engulfing appears when the first small candle is bearish and the second big candle is bullish. The pattern suggests a shift from bearish to bullish. Meanwhile, a bearish engulfing appears when the first small candle is bullish and the second big candle is bearish. The pattern suggests a shift from a bullish to a bearish trend.
Harami
A harami pattern also consists of two candles, the first one is big and the second one is small. The second candle is completely within the body of the first candle.
A bullish harami is formed when a small bullish candle follows a large bearish candle. It suggests a bearish trend is weakening and a potential for the beginning of a bullish trend.
Meanwhile, a bearish harami is formed when the first candle is bearish and the second small candle is bullish. It suggests that the bullish trend is weakening, and there is a potential for the beginning of the bearish trend.
Hammer
Hammer is a candlestick trading chart pattern with a small body representing less difference between the opening and closing price. It also has a long shadow that almost doubles the body.
The candle appears at the bottom of the downtrend and is generally green in color. It suggests that a bullish trader has managed to control the selling pressure and pushed the prices upward.
Hanging Man
Hanging Man looks the same as the hammer with a small body and a long wick. The only difference is that it appears at the end of an uptrend. It indicates the end of an uptrend and the potential for a price drop.
Spinning Top
Spinning top is a candlestick pattern with a small body and similar shadows. It can be green or red in color, indicating a period of consolidation or indecision in the market.
Marubozu
Marubozu is an extremely powerful candlestick pattern showing a strong bullish or bearish trend, depending on the color. It has a long body with no lower or upper shadow.
It can suggest a trend reversal or continuation. When the candles follow the prevailing trends, it indicates a continuation, and when the candles form against the prevailing trend, it suggests a trend reversal.
Shooting Star
A shooting star is formed during an uptrend. It has a tiny body and a longer upper wick, at least double the length of the body. It indicates a trend reversal from bullish to bearish.
Pros of Candlesticks Trading
- Candlesticks provide a visual representation of the asset price over a chart. You can track historical price moves, prevailing trends, and momentum. Also, you can analyze price fluctuations during different time frames.
- Candlesticks provide a comprehensive overview of asset prices over a period. You can identify the opening, closing, high, and low prices. Also, you can even determine whether it is bullish or bearish.
- You can use candlesticks trading in forex, stocks, indices, cryptocurrencies, and other financial markets. As the concepts and principles are the same and universally applicable.
Cons of Candlesticks
- Candlesticks are ideal for determining short-term selling opportunities but may not be suitable for long-term trading. Thus, you need to consider the broader market aspects for trading in a long-term frame.
- Candlesticks are based on probability, which means that there is a high probability that the market will move in a particular way. However, they may generate false trading signals.
- Candlesticks are not sufficient to interpret the market. You need to use technical analysis indicators and tools for confirmation.
Conclusion
Candlesticks can be a valuable technical analysis tool for interpreting the market. It can improve your decision-making, assist you in risk management, and enhance your overall strategy.
The entire technical analysis is based on candlesticks. So, knowledge of candlesticks is crucial if you want to trade in the financial market. In the above blog, we had a short overview of candlesticks.
However, candlestick is a broad concept, and there are numerous patterns. For a detailed study of multiple chart patterns and interpretations, you can read our candlestick trading pattern PDFs which are available for free.
Also, analyzing requires a lot of time and knowledge. And you may not have that. So you can even seek the assistance of Carlos and Company to get daily market analysis with buy and sell signals.