
Guide to Moving Average and Fibonacci Bands Trading Strategy
Moving averages and Fibonacci Bands are the two most important technical analysis indicators. And when you combine these two elements, the chances of trade success are high.
Wait, you don’t know how to use the Fibonacci moving average? Not to worry. In Carlos and Company this blog, we will have an in-depth study of Fibonacci and moving averages.
Understanding Fibonacci Retracement Strategy
Fibonacci Retracement is a continuous series of numbers, where the next number is the sum of the last two numbers. Like: 0,1, 1, 2, 3, 5, 8…….∞.
In the trading world, the Fibonacci sequence is used to determine key retracement levels on the chart. The key Fibonacci retracement levels include 23.6%, 38.2%, 50%, and 61.8%.
The 38.2% and 61.8% levels are regarded as Fibonacci retracement golden ratio.

This helps traders identify the potential support and resistance levels and plan trade entries and exits accordingly.
Whenever the price reaches 38.2% and 61.8%, it suggests a trend reversal, indicating traders open a trade in the opposite direction. Meanwhile, when the price breaks these levels, it suggests trend continuation, indicating that a trader should open trade in the direction of the trend.
Here's a quick look at what you'll read
Fibonacci moving averages are specific EMAs based on Fibonacci sequence numbers, such as 5, 8, 13, 21, 34, 55, 89, 144, and 233.
The best indicator with Fibonacci is the Relative Strength Index (RSI), as it helps confirm potential reversals at Fibonacci levels.
The best indicator with moving average is the MACD (Moving Average Convergence Divergence) for identifying trend strength and crossovers.
Understanding Moving Averages Strategy
Moving averages refer to the average price of the asset over a specific period. It is amongst the most popular technical analysis tools that help traders predict asset price movements.
Traders take moving averages of two periods into consideration when using this strategy. Generally, one is short-term with the time frame of 14 MA, 20 MA, or 50 MA, and the other is long-term with the time frame of 100 MA or 200 MA.
When the short-term moving average moves above the long-term line, it suggests a potential for a bullish move. Meanwhile, when the short-term moving average line moves below the long-term line, it suggests a potential for a bearish move.
Types of Moving Averages
Simple Moving Average (SMA)
SMA is the most basic moving average that usually considers the closing price of an asset when calculating the moving average.
Exponential Moving Average (EMA)
EMA is an advanced version that takes the recent price into consideration for calculation. Being the advanced version, it responds instantly to market change and helps traders make quick decisions.
How to use Moving Average and Fibonacci Bands
Fibonacci retracements and moving averages both are valuable trading indicators. However, you cannot depend entirely on any one of these tools to make trade decisions.
Technical analysis tools can generate false signals. Thus, indicators are used in combination in the market. You can combine them with any tools, however they need to be compatible.
Moving averages and Fibonacci retracement makes a great combination. Here is a step-by-step guide for using this combo:
Identify the asset and decide the time frame
The foremost step is to select an asset you want to trade. You can go for any currency pair, commodity product, cryptocurrency, stock or indices.
Once you have selected an ideal trading asset, decide the time frame. Find out whether you want to trade for short-term time frames, such as minutes, hours or days or long-term, such as a few days to months. Based on the duration, select the time frame of the chart.
Identify the current market trend
Trend is a trader’s friend when using technical analysis strategies. So determine whether the market is bullish, bearish or sideways. Also, analyze the trend’s strength to have an overview of the market.
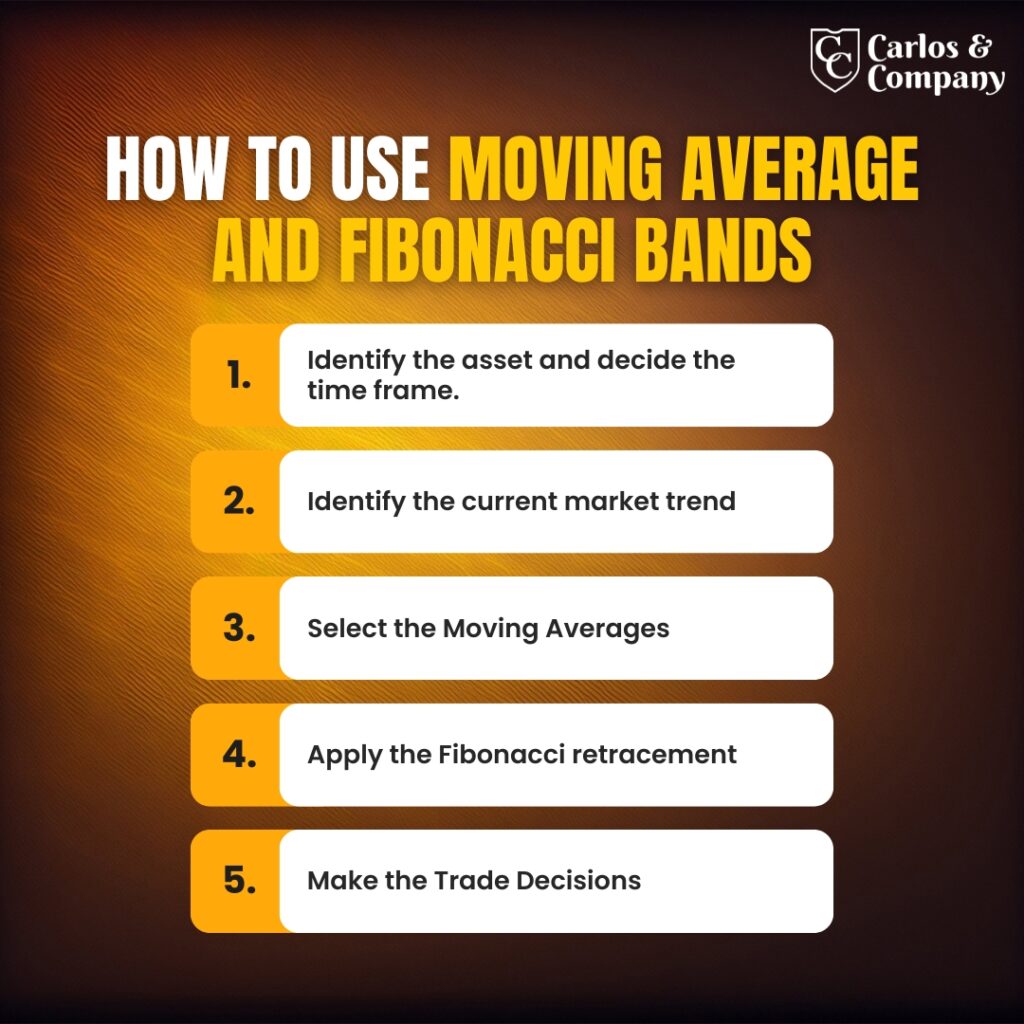
Select the Moving Averages
Go to the indicator section of your charting software and select moving averages for two periods. You can go for any of your favorite short-term and long-term frames. Generally, traders choose 50 days MA for the short term and 200 days for the long term.
Apply the Fibonacci retracement
Again, go to the settings and apply the Fibonacci retracement. Identify the chart’s key supports and resistance levels based on Fibonacci levels.
Make the Trade Decisions
Now, you can use the Fibonacci moving average strategy. When the price breaks the Fibonacci resistance level and the short-term MA crosses above the long-term MA, it signals a strong potential for bullishness. Both indicators suggest the potential for a price rise, so you consider opening a long position.
When the price breaks the Fibonacci support level, and the short-term MA crosses below the long-term MA, it signals a strong potential for bearishness. Both indicators suggest the potential for a price fall, so you consider opening a short position.
Also when both the indicators are giving opposite interpretations avoid placing any trades. You can even use any other technical analysis indicator to have a clear picture of the market.
Advantages of Fibonacci Moving Averages
- The chances of false signals are minimal when combing the moving averages and Fibonacci bands. The indicators are the best and most popular, which ultimately leads to greater accuracy and high profitability.
- These tools are available for free on almost every charting software. Also, interpreting them is quite easy. Even market newbies with little understanding of technical analysis can use the strategy.
- You can use the strategy to trade diverse assets in diverse markets. The concepts, rules, and basics remain similar irrespective of the trading instrument and the market.
- Short-term traders such as scalpers, day traders, and swing traders and long-term traders such as position or buy-hold traders can use this strategy.
- The combination of Fibonacci and moving averages provides a comprehensive analysis. You can identify exact trade entries and exits, as well as strong support and resistance levels that result in informed trading decisions.
Disadvantages of Fibonacci Moving Averages
- The chances of false signals are minimal but not negligible. This means that even after using the best Fibonacci retracement settings and proper moving averages, false signals can be generated.
- Fibonacci and moving average are technical analysis tools. So the strategy’s effective execution requires an understanding of technical analysis.
- Fibonacci Moving average numbers only takes technical analysis into consideration. It ignores fundamental market conditions such as economic data, news releases, announcements, geopolitical, and other events. However, these factors can change the entire market and affect your trade.
- The Fibonacci Moving Averages strategy is subjective. This means that two traders using the same strategy may interpret the market differently.
Bottom Line
Moving average and Fibonacci bands are the best tools for technical analysis traders. You can use the combination irrespective of the trading strategy, instruments and markets.
However, the knowledge of overall market conditions is essential. It will help you make informed trading decisions and deal with the strategy limitations.
Also, if you are struggling to use this strategy, Carlos and Company is there to help you. We provide daily market analysis using a combination of moving averages, Fibonacci retracements, Bollinger Bands, Relative Strength Index, and many other indicators. Join us for trading alerts based on technical analysis indicators.
