
Learn The Concept for Support and Resistance Indicators in Trading
Financial trading is a process of identifying the right assets at the right time to take advantage of their price fluctuation. Support and resistance are the crucial technical analysis indicators that help you throughout the trade in making informed decisions. In this article, we will understand the key concept of these support and resistance indicators and how they work.
Introduction to supports and resistance levels.
The price of financial assets rises and falls based on demand & supply.
When demand is more, and supply is less, the asset’s price increases and moves in an upward direction.
When the supply is more, and demand is less, the price of the asset decreases and moves in a downward direction. When there is an equilibrium in demand and supply, the price moves in the sideward direction.

The concept of support and resistance levels is based on demand and supply. You can use these indicators in trading forex, stock, cryptocurrencies and other financial assets.
Here's a quick look at what you'll read
Support in trading refers to the price level where the downtrend stops or pauses and takes a reverse in an upwards direction.
When the supply of an asset at a particular price is strong enough to stop the upward trend and pushes a downtrend, that level is known as the resistance level.
The best indicators include Pivot Points, Fibonacci Retracement, Moving Averages (200-day), and Bollinger Bands, as they help identify key price levels where reversals may occur.
Support and resistance can be identified by analyzing historical price levels, trendlines, moving averages, Fibonacci retracements, and volume spikes where price tends to reverse or consolidate.
Pivot Points, VWAP (Volume Weighted Average Price), Bollinger Bands, and moving averages (e.g., 20 EMA) are commonly used for scalping as they help identify quick price action reversals.
Manually mark key price levels where the price has previously reversed, use trendlines, apply Fibonacci retracement, or use built-in support and resistance indicators in platforms like MT4, MT5, or TradingView.
What is Support?
Support in trading refers to the price level where the downtrend stops or pauses and takes a reverse in an upwards direction. At the support point, prices of an asset stop falling.
When the demand for an asset at a particular price is strong enough to stop the downtrend and pushes an uptrend, that level is known as the support level.
In technical analysis, the historical price patterns are analyzed to speculate a particular asset’s future price movement. Support is a crucial technical analysis level where every time the price reaches that level, there is a hope that it will move in an upward direction.
Support indicators help the trader to identify potential buying opportunities. These previous low points are indicators for traders that prices will bounce back.
Let us understand the forex support indicator with an example. Suppose you are trading EUR/GBP. The price of the pair is declining and reaches 1.1150. You have analyzed past trends and found that whenever prices reach this level, the downtrend stops and the price will bounce back.
In this case, it is the right time to go long. So if the price moves upward, you can make a profit. However, it is also possible that the price breaks the previous lows and falls further.
What is resistance?
Resistance is another crucial technical analysis indicator and is the exact opposite of the support level. When the supply of an asset at a particular price is strong enough to stop the upward trend and pushes a downtrend, that level is known as the resistance level.
In other words, the Resistance level is when the price of an asset stops rising and starts moving in the opposite direction. It is a level where the upward trend stops, and the price of an asset starts falling.
Resistance indicators help the trader to identify potential selling opportunities. Let us understand the resistance indicator with an example. Suppose you are trading with EUR/GBP currency pair.
You observe that whenever the price reaches 1.1100, it struggles to rise further and starts dropping. It indicates that it is the right time to go short.
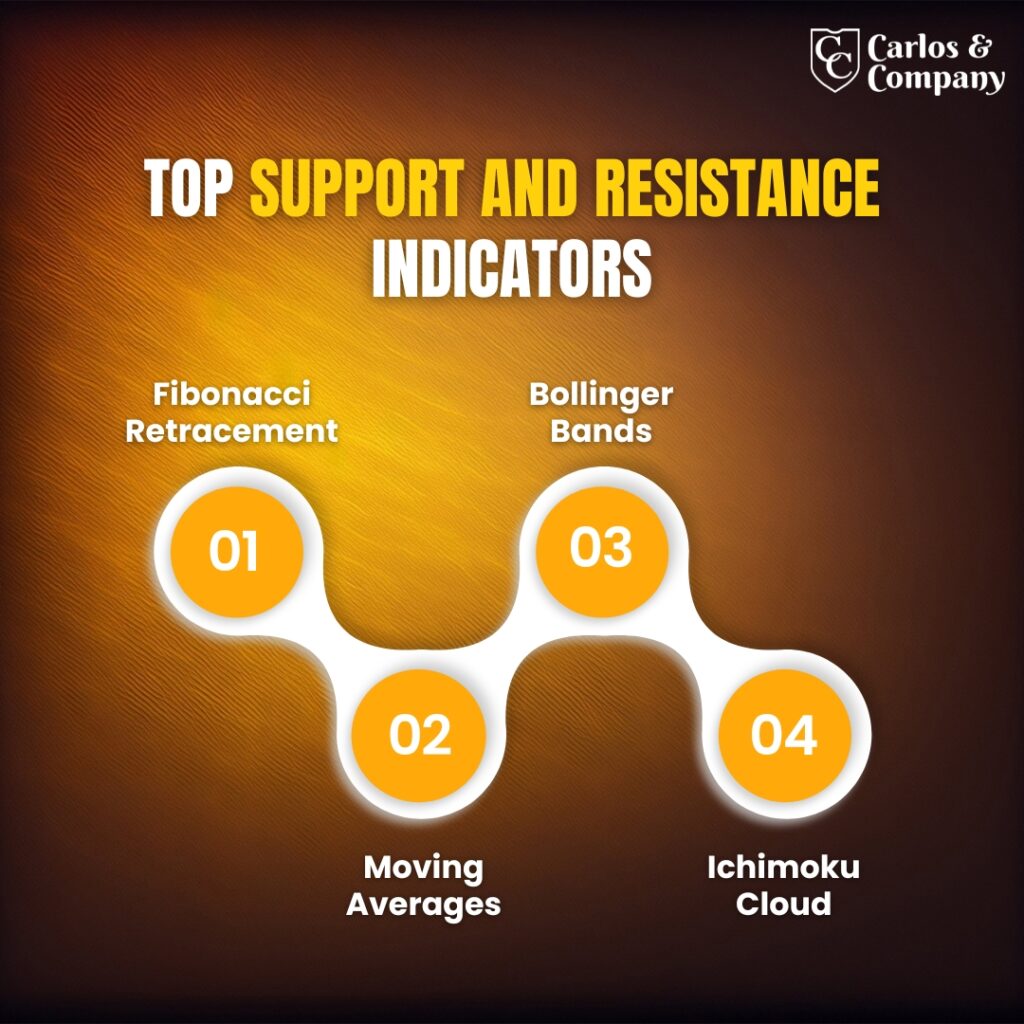
Most Popular Support and Resistance Indicators
We have understood the concept and importance of support and resistance point in the financial market. Now the question is how will you determine these levels?
You can use different tools or indicators to identify these pivot points. Here are some popular indicators with their key features.
Fibonacci retracement
The first in the list is the Fibonacci indicators, the most valuable indicators for finding levels of support and resistance. It can be defined as horizontal lines formed to mark the level when a price trend stops & moves in the reverse direction.
These Fibonacci levels are defined in ratios or percentages. Here are popular levels and what they indicate
- 23.6%: Indicates minor corrections during an ongoing trend.
- 38.2%: Indicates moderate retracements within a trend.
- 61.8%: Known as the golden ratio, it used to indicate a solid potential reversal
- 78.6%: Deep retracement level to indicate a significant pullback or reversal zone.
Bollinger Bands
Bollinger Band was developed by John Bollinger; it is a popular technical analysis indicator that helps to determine volatility, overbought and oversold conditions. There are three bands Upper, lower and middle.
The upper band indicates the resistance level, while the lower one indicates the support level. The middle band represents the average price over the last 20 periods.
When the bands expand, it indicates higher volatility in the market and vice versa. When the price touches the upper band, it indicates overbought; when it touches the lower band, it indicates oversold conditions.
Moving Averages
Moving Averages are statistical technical tools used to determine dynamic trading support and resistance levels. Under this, the mean value of an asset over a particular period, like for a week, 15 days or a month is calculated to determine key market insights.
There are different moving averages, including Weighted Moving Averages, Simple Moving Averages, Exponential Moving Averages, etc. Apart from support & resistance points, you can get other pivot information also using these points.
Ichimoku Cloud
Ichimoku Cloud is a widely used trading indicator developed by a Japenses Journalist. It gives a comprehensive market insight, including entry, exit, support, and resistance points.
It comprises seven levels, including two clouds that help determine the trend or momentum. When the price reaches above the cloud, it indicates an upward trend and vice versa. These clouds also serve as dynamic support & resistance indicators.
Wrapping Up
The knowledge of support & Resistance Indicators is crucial for making effective trade strategies, determining price trends, stop loss and take profit points.
These technical analysis indicators enable you to trade logically by analyzing historical data. However, remember these levels are not always accurate.
In some cases, due to fundamental analysis factors or unexpected events, the whole market scenario changes, and the market moves against the traders’ prediction breaking these points.
So, you cannot solely depend on these indicators. It is essential to keep an eye on the overall market condition and give importance to fundamental and correlation analysis. Also, use multiple types of support and resistance tools to stand out from the crowd and stay consistently profitable.
