Pivot Point Trading: Meaning, Calculation, Pros & Cons
Pivot Points are amongst the most basic technical analysis concepts for trading financial assets. However, understanding the key points and placing a trade using them are two different things. In this article, we will learn about pivot point trading and how to calculate and interpret it.
What is a Pivot Point in Trading?
Pivot Point can be defined as the mean of the high, low, and closing price of the financial asset. It provides traders with valuable market insight regarding the future price movement of the asset to place trade accordingly.
Pivot trading is the buying and selling of financial assets based on the support and resistance levels.

It is mainly for short-term or intraday traders, as it is calculated based on the price data of the previous day. It means the insights are helpful for trading on that particular day only.
Traders widely use the Pivot point trading strategy for trading in different financial assets, including forex, cryptocurrencies, commodities, stocks, and indices. Also, its calculation and interpretation are simple, irrespective of the asset. This method allows you to diversify your trading capital in different markets.
Here's a quick look at what you'll read
Pivot Point can be defined as the mean of the high, low, and closing price of the financial asset.
A pivot point is a technical analysis indicator used to determine potential support and resistance levels based on the previous day’s high, low, and close prices.
A common strategy is to trade breakouts or bounces off pivot levels, using them as support/resistance. Traders often combine them with confirmation signals like candlestick patterns or momentum indicators.
The success rate depends on market conditions, strategy execution, and risk management. When used correctly with confluence factors, pivot points can improve trade accuracy, but no fixed success rate exists.
Yes, they help identify key price levels, offering reliable trade setups for intraday and swing traders, especially when combined with other technical indicators.
How to calculate Pivot Point in trading
Many traders find difficulty in pivot point calculation. However, it is quite simple; let us discuss the elements and calculations to understand better:
Support
It is the level where the downtrend is expected to stop and reverse. When the price reaches the support level, traders go long, hoping that it will rise in the future.
Resistance
It is the level where the uptrend is expected to stop and reverse. When the price reaches the resistance level, traders go short, hoping that it will fall in the future. Generally, you should consider two strong supports and resistance for trading pivot points.
High Price
It is the highest price level that an asset reached on the previous day.
Low Price
It is the lowest price level that the asset reached on the previous day.
Closing Price
The last or closing price at which the asset has been traded on the previous day.
Pivot Points Calculation Formulas
Pivot Point = (Previous High + Previous Low + Previous Close) /3
Support 1 = (Pivot x 2) – Previous High
Support 2 = Pivot – (Previous High – Previous Low)
Resistance 1 = (Pivot x 2) – Previous Low
Resistance 2 = Pivot + (Previous high – Previous low)
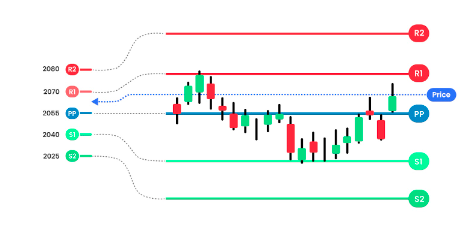
Let us have a look at a gold trading example to understand better. Suppose the previous day’s High, low, and closing prices for gold are $2070, $2040, and $2055.
PP = (PH + PL + PC)/3
PP = (2070+2040+2055)/3
PP = 2055
S1 = (PPx 2) – PH
S1= (2055×2)- 2070
S1=2040
S2 = PP – (PH – PL)
S2= 2055 – (2070-2040)
S2= 2025
R1 = (PPx 2) – PL
R1= (2055x 2) – 2040
R1= 2070
R2 = PP + (PH – PL)
R2= 2050 + (2070-2040)
R2= 2080
We have discussed the process of calculating the pivot point. But guess what? We have good news. You don’t need to calculate pivot points manually; numerous software are available there to do it. You just have to adjust the settings of the charting platform accordingly.

How to interpret pivot points in trading
The concept of pivot point trading is based on two conditions: pivot point bounce and breakouts. Let us understand how to interpret these technical analysis tools:
Pivot Point Reversal
Pivot point bounce is when the asset price approaches the support or resistance level, and the direction of the trend is expected to change.
When the asset price approaches the support level, the trend is expected to reverse from bearish to bullish. It signals to open a long position.
When the asset price approaches the resistance level, the trend is expected to reverse from bullish to bearish. It signals to open a short position.
Pivot Point Breakouts
It is a condition when the price trend is so strong that it breaks the key support or resistance level, and the ongoing trend is expected to continue.
When the asset price breaks the support, it suggests that the bears are in power and prices are expected to fall further. It signals traders to open a short position.
When the asset price breaks the resistance, it suggests that the prices are expected to rise further. It signals traders to open a long position.

Usage of Pivot Points
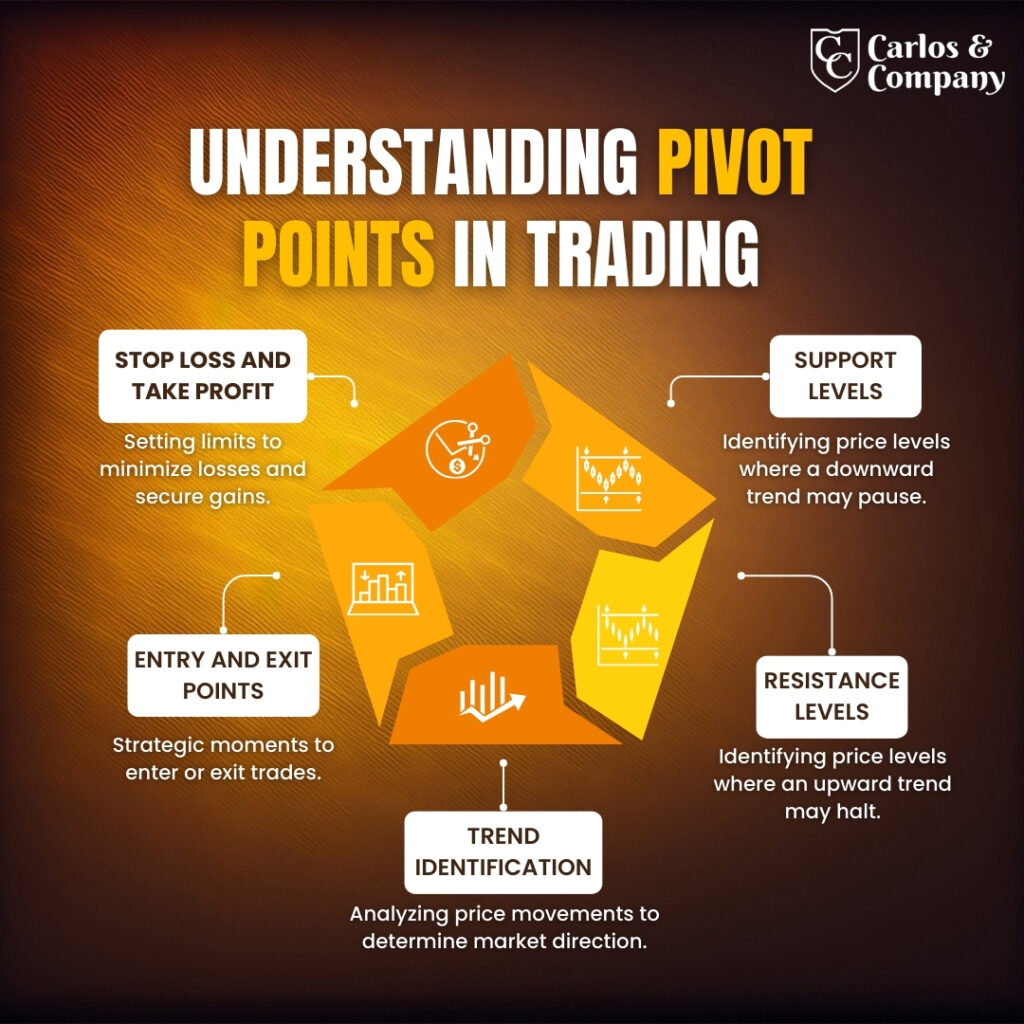
Trend Identification
Pivot points are mainly used to identify the overall trend and potential price reversal. A breakout to the upside indicates a continuation of an uptrend trend, and a breakout to the downside indicates the continuation of downtrend.
Determination of Entry and exit points
A trader can identify potential buying and selling levels using these technical analysis tools. A trader can enter a trade when the price approaches the support or resistance level and set exit accordingly.
Setting Stop loss and take profit
Stop loss and take profit are two crucial levels to safeguard your profit and eliminate the chances of excessive losses. You can also identify these critical levels by trading pivots.
When you are opening a long position, you can set the stop loss below the support level and take profit above the resistance. Meanwhile, when you are opening a short position, you can set the stop loss above the support level and take profit below the resistance.
Advantages of Pivot Point Trading
Pivot point indicators can be used to predict the dynamic financial market. Let us quickly discuss the benefits of using pivot points in trading
Objective
One of the best parts of trading pivot points is objectivity. In technical analysis, almost every indicator is subjective, which means different traders can make different interpretations by looking at it. However, pivot points are objective or fixed, which means these remain the same throughout the day.
Simplicity
Pivot point calculations are quite easy, and as we have discussed above, you can use charting software to automatically calculate them. Also, pivot points are simple to understand and easy to interpret. So, even a beginner can place a trade using pivot points.
Indicator Confirmation
Another benefit of trading pivot points is you can integrate them with technical analysis indicators in the chart. Pivot points can also be used to confirm the interpretations of indicators like Bollinger Bands, Fibonacci retracement, and many others.
Market Sentiment Analysis
Pivot points trading charts can provide valuable market insight that ultimately helps you in analyzing overall sentiment. You can get an overview of what the majority of traders feel about buying or selling the financial instrument.
Disadvantages of Pivot Point Trading
Like any other tool or trading concept, pivot points also have some limitations. So, before using these tools for trading forex or any other financial instruments, let us have a look at its downside
Ignore market Volatility
olatility is the degree of asset price fluctuation over the period. It is the most critical factor to consider for trading. However, pivot points are calculated without considering the volatility.
Ignore current market conditions
Whether you are trading in forex, stocks, cryptocurrencies, or any other financial market. The Fundamental analysis has the power to change the entire market scenario. Therefore, watching current market conditions while trading pivot points is a must.
Lagging Indicators
Pivots Points are lagging indicators, which means these are based on historical data. As a result, they provide signals only when the price has hit a historical level. So, there is a possibility that you may get delayed or false signals that result in losses.
No Guarantee profit
While pivots trading or using any other technical analysis indicators, you need to understand that they are not foolproof.
Pivot points are based on historical price patterns. It means that it is expected that the price will rise or fall, but there are chances that the price may move in the opposite direction.
Wrapping Up
Pivot points can provide traders with valuable insights that ultimately help traders identify potential buying and selling opportunities.
However, before starting pivot point trading, get an impeccable understanding of its concept. Also, every pivot point bounce or breakout is not an indication to enter a trade.
And the understanding of when to open a trade or when to wait for the right time comes from practice. So clear your basics, practice pivots trading, and enjoy profitable outcomes.
