How to Read the XAU/USD Chart?
Gold is one of the most favorite assets to trade, and there are numerous ways to do so. Gold forex is amongst the most famous ones where traders can trade gold without owning it.
However, many traders face difficulty determining the right gold trading opportunity. But that is not difficult. You just need to learn XAU/USD chart analysis and interpretation.
Wait, you don’t know how to do so. Not to worry. In this Carlos and Company blog, we will discuss all you need to know about the Gold USD chart trading.
What is the XAU/USD Price Chart?
The XAU/USD chart is the graphical representation of XAU to USD in order to represent the price movements of the pair through statistics and numbers.
Under the XAU/USD pair, XAU means gold, while USD means US Dollars. XAU is the base asset, while USD means the quote asset. Traders buy the pair when they feel that XAU rises against USD and sell in the opposite case.
Now, have you ever thought about how a person will identify when to buy and when to sell? The answer is simple, just with the help of a gold price chart.
A gold chart can help you see the pair’s price movement in different time frames. Traders can analyze the current market trends, volume, liquidity, and sentiment and can even predict future price movements just by watching a chart.
Here's a quick look at what you'll read
XAU/USD is a forex pair where XAU represents gold and USD represents the US Dollar.
X signifies a non-physical asset, and AU is a scientific symbol for gold. As you trade gold without owning it in the CFD market, it is called XAU.
XAU/USD is all set to reach its lifetime high $3500 in the upcoming months.
Analyze price trends, support/resistance levels, and technical indicators like RSI or MACD to understand gold’s movement against the US dollar.
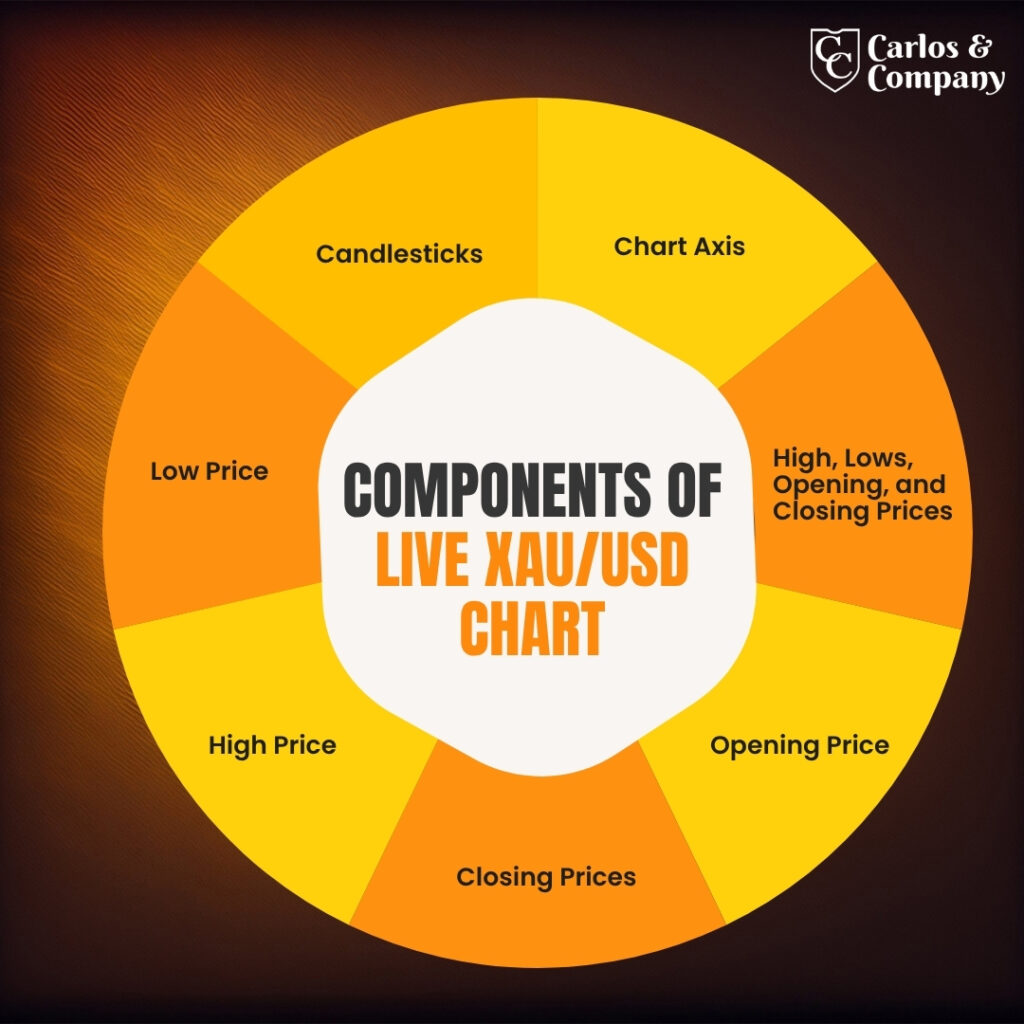
Components of Live XAU/USD Chart
The first thing you need to do to interpret the gold chart is to understand its key components. Here are the top elements of a chart every trader should know:
Candlesticks
In the forex market, traders generally use the XAU/USD candlestick chart. Under this, the price movements are represented by the candlestick.
A candlestick contains a body, two wicks, or shadows. The candle represents the price movements of the pair over a particular period. Like in a daily chart, one candle represents the prices of a day.
Also, one more thing. Bullish movements are expressed through a white or green candle, and Bearish movements are expressed through a black or red candle.
Chart Axis
Like any other mathematical chart, a live gold chart has two axes. The vertical axis shows the price of an XAU/USD over time. Meanwhile, the horizontal axis represents the time frame of price change.
High, Lows, Opening, and Closing Prices
Traders can analyze the price of XAU/USD by below price levels, which you can find on a chart:
Opening Price
The opening price is the level at which prices were at the start of a trading period. In the bullish candle, the top of the candle shows the closing price, and in the bearish candle, the bottom shows the opening price.
Closing Prices
The closing price is the level at which prices are reached at the end of a trading period. In the bullish candle, the top of the candle shows the opening price, and in the bearish candle, the bottom of the candle shows the closing price.
High Price
High price means the highest level XAU/USD reached over a period. It is represented through the upper wick of a candle.
Low Price
Low price means the lowest level of XAU/USD over a period. It is represented through the lower wick of a candle.
How to interpret XAU/USD charts
You can interpret a chart by monitoring the components. Here are the points you need to do so:
Watch Key Price Levels
Keep an eye on support and resistance levels. Generally, when the XAUUSD price reaches the support level, a trend reversal is indicated, and when the price reaches the resistance level, a trend continuation is indicated.
Learn Candlestick Patterns
When the XAU/USD price moves, it creates a pattern over a chart. When a specific pattern appears on a chart, it suggests a trader to take a move. So, for interpreting, learn about different candlestick patterns and what they indicate.
Analyze the Strength of Trends
Trends refer to the direction of price movement of assets over a specific period. For trading gold, keeping a watch on current trends is a must. You can identify the uptrend, downtrend, and sideways through the XAUUSD chart and make trade decisions accordingly.
Use Trading Indicators
One of the best ways to interpret charts is by using technical analysis indicators. Traders can set up Bollinger Bands, Relative Strength Index, oscillators, moving averages, and volume indicators on the gold USD chart. These indicators provide key findings regarding XAU/USD movements, and traders can even make buy and sell decisions.
Mark Economic Events
Gold and XAUUSD are highly affected by the news, announcements, and economic reports. The best part is you can even mark the date and timing of such events on the chart. So you can analyze what changes a particular event made to gold prices.
XAUUSD Price and Live Gold Chart Analysis
Monitoring the XAUUSD price is crucial for traders. The live XAUUSD chart provides real-time data, allowing you to make informed decisions. By analyzing the gold USD chart, you can identify trends and potential entry or exit points.
For example, if the XAUUSD price shows a strong upward trend, it might indicate a bullish market, suggesting a potential buy opportunity. Meanwhile, if the chart shows a strong downward trend, it signals a bearish market, indicating a potential sell.
XAUUSD Today: Buy or Sell?
Deciding whether to buy or sell XAUUSD today depends on various factors. Analyzing the live XAUUSD chart can provide insights into current market trends.
If the gold price is rising and breaking resistance levels, it might be a good time to buy. However, if the price is falling and breaking support levels, selling might be the better option
Additionally, considering the latest XAUUSD news can offer context to price movements. For example, economic data releases or geopolitical tensions can influence the gold price, affecting the XAUUSD pair.
Staying updated with XAUUSD news is a must for traders. Economic indicators, geopolitical events, and market sentiment can significantly impact the XAUUSD price. Thus, traders should regularly check for XAUUSD news to stay ahead.
Conclusion
XAU/USD is regarded as a safe haven asset with numerous trading benefits. It includes an inflation hedge, diversification, high profitability, high liquidity, and suitability for diverse trading strategies.
However, you can only get these benefits with proper knowledge.
Understanding the XAU/USD chart is essential for anyone interested in trading gold. By analyzing the gold USD chart, staying updated with XAUUSD news, and monitoring the live XAUUSD price, traders can make informed decisions.
Want to know whether buy or sell XAUUSD today?
Carlos and Company is there for you. Contact us to get daily XAUUSD chart analysis, buy or sell gold alerts, or access to top gold news with its impact.