Flag Trading: Beginners’ Guide to Trade Candlestick Patterns
Flags are amongst the most popular technical analysis tools for identifying potential trading opportunities. Whether you are trading forex, commodities, stocks, or any other financial assets, flags serve as a valuable guide to your trading journey.
Flag trading can be a great strategy to buy or sell financial assets. And guess what? The amazing part about this method is that you just need basic knowledge to get started.
Want to learn trading flag patterns? In this Carlos and Company, we will discuss the flag trading strategy and how to implement it effectively to get the desired result. So let’s get started.
What is flag trading?
Flag trading is identifying a flag-like structure on the trading chart and placing a trade based on it. A flag pattern consists of two parallel trendlines and a flag pole.
When the flag pole breaks the key levels on the chart, it suggests that traders should place trades in the direction of the trend. Traders use the pattern for determining both long-term and short-term opportunities in diverse assets.
Here's a quick look at what you'll read
After a short pause, bull and bear flags indicate that prices will keep moving. When a bull flag is broken, buy; when a bear flag is broken, sell. Use stop-loss to help you manage your risk.
A bull flag happens when the price pulls back slightly during an uptrend, before rising again. When a downtrend occurs, the prices of an asset keep dropping and reach new lows and highs.
A bearish flag can be used to take some profit from your trade. When the flag breaks down, traders usually sell and choose a target that is the same size as the earlier price drop.
After a bearish flag, the price usually keeps falling. Traders anticipate a big fall like the one before the flag, but it might not happen every time.
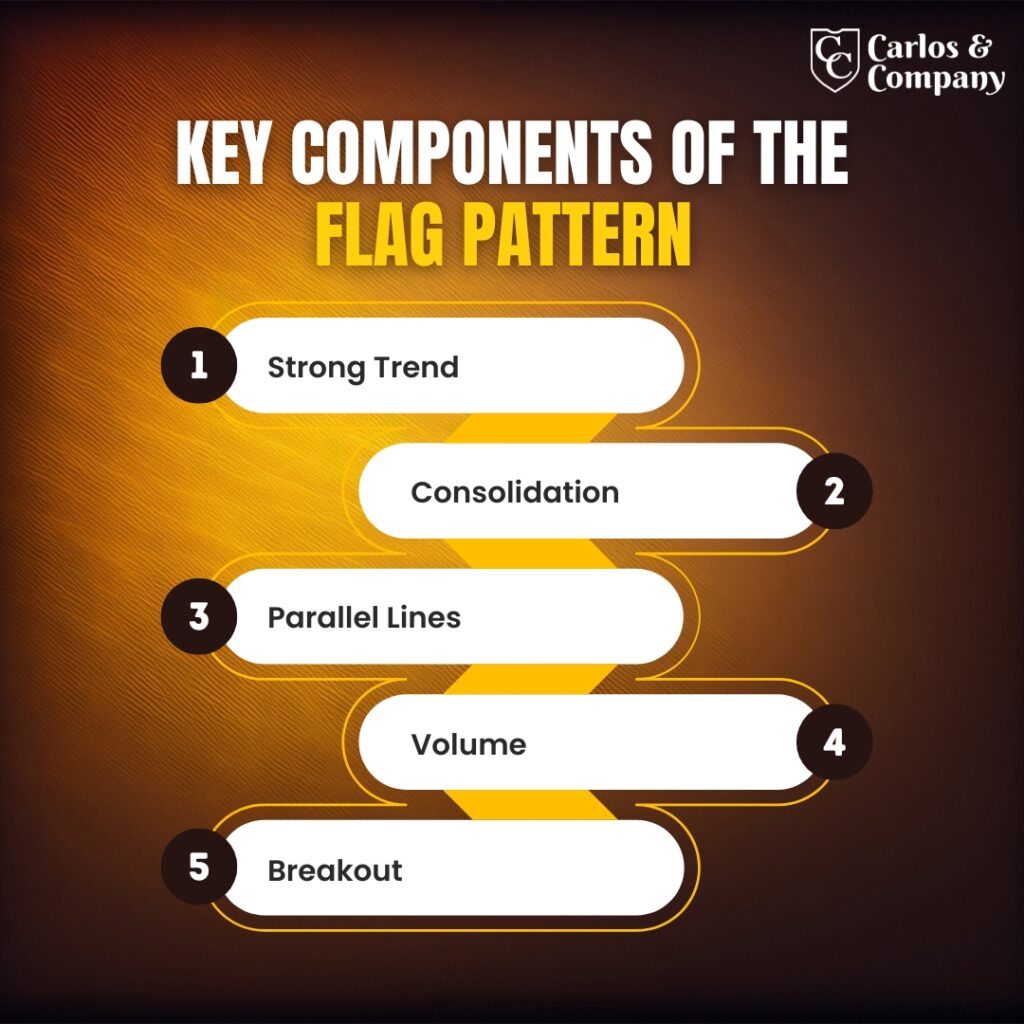
Key Components of the Flag Pattern
You may struggle to identify a flag pattern, or in some cases, you may locate the wrong pattern. So, for effective recognition, watch the component below in a pattern:
Strong Trend
A flag appears after a strong trend. It can be either bullish or bearish.
Consolidation
Flags generally appear after an ongoing trend. However, after the strong trend, the price of the assets moves within a consolidated range.
Parallel Lines
Under the patterns, two parallel trend lines form, connecting the highs and lows of the asset price.
Volume
The pattern is accompanied by declining volume after an initial increase.
Breakout
A flag pattern is confirmed by the breakout in the direction of the trend. When the price breaks the consolidated range, it is expected to move in the direction in which the breakout occurred.
Types of Flags
Bullish and bearish flag patterns are the two major types of technical analysis concepts. Each has its own property and interpretation; let us understand them separately:
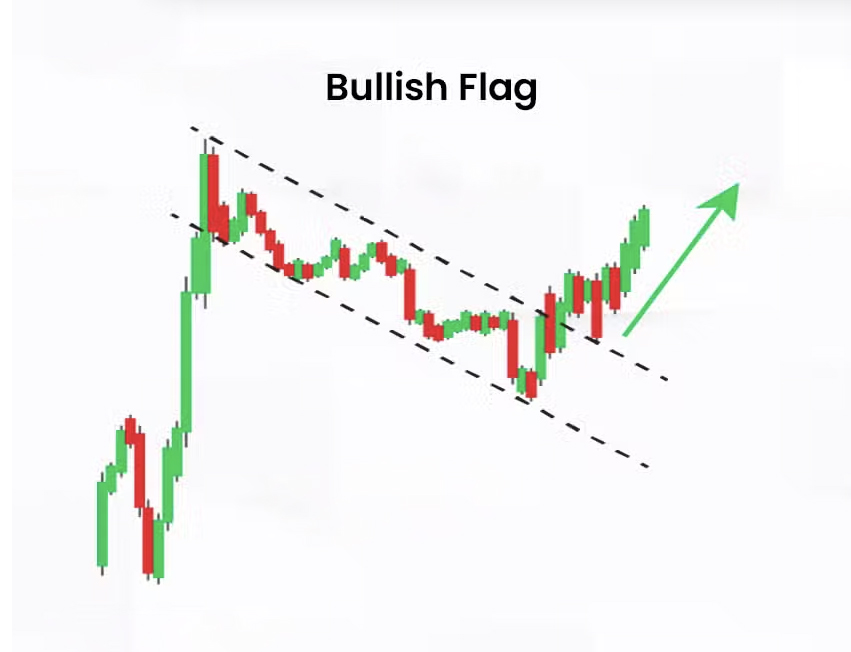
Bullish Flag Pattern
A bull flag occurs after a strong uptrend during a brief period of consolidation. It consists of two parallel lines, the upper and lower.
Bullish traders wait till the price breaks the upper trend line. When the price breaks above the upper trend line, it indicates that traders should open a buy position.
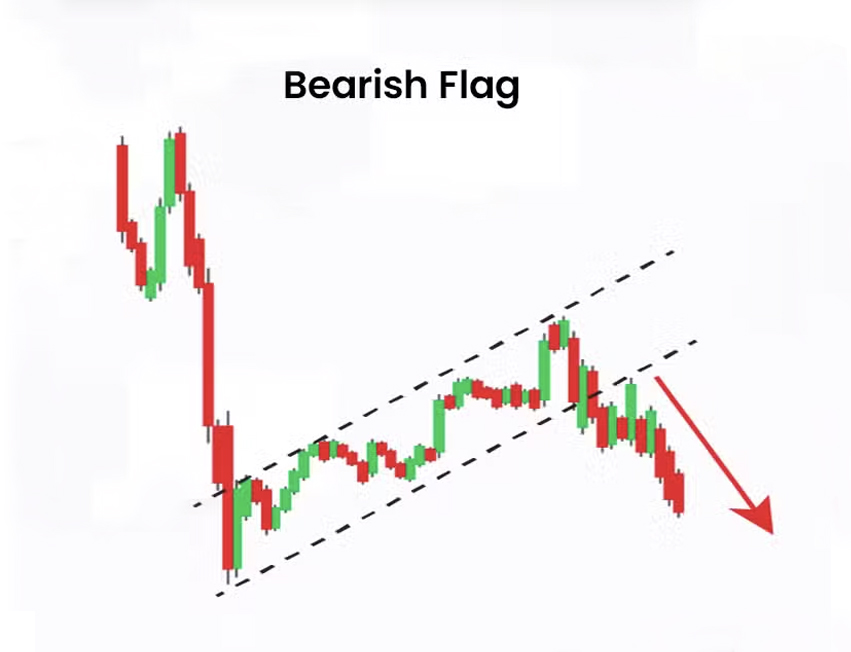
Bear Flag Pattern
A bear flag occurs after a strong downtrend during a brief period of consolidation. It consists of two parallel lines, the upper and lower, that move in the form of a downward slope.
Bear, wait till the price breaks the lower trend line. When the price breaks below the lower trend line, it indicates that traders should open a sell position.
How to Trade Flags
Identify the Flags
Open the chart of your preferred trading time frame and look for a period of consolidation after a prevailing trend. Ensure that the price moves between the parallel lines; the trend line should not converge. Also, check the components of the flags we have studied above for the correct identification pattern.
Wait for a breakout
Once you have identified a flag trading pattern, now wait till the price breaks the key support or resistance trendlines. A flag pattern only confirms with the price breakout. A price breakout suggests that traders have managed to push the price in the direction of the initial trend.
Use Technical Analysis Indicators
A flag pattern may not be sole sufficient for making trade decisions. Thus, use indicators such as volume indicators, Bollinger bands, Fibonacci retracement, and Relative Strength Index. These indicators will confirm whether the interpretations of the flag pattern are trade-worthy or not.
Place buy or sell trades
When a bullish flag pattern occurs, wait for the resistance breakouts. Once the price breaks the resistance, take a buy position. Meanwhile, when a bearish flag pattern occurs, wait for the support breakouts. Once the price breaks the support, take a sell position.
Place Stop Loss and Take Profits
The stop loss is placed under the opposite key level. Suppose if the price breaks the support, then the stop loss will be placed below the resistance level. For placing the take profit, you can set the level as the height between the upper and lower trendlines.
Pros of Flag Trading
- Flags are applicable in diverse markets, and traders with diverse trading strategies can use them.
- Spotting, identifying, and trading the flags is quite easy even for a beginner.
- The flag pattern provides comprehensive information. Traders can even identify the exact entry and exit point using the tool.
- Traders need to be very quick in identifying the pattern and placing the trade; otherwise, they can lose the opportunity.
Cons of Flag Trading
- Not every flag pattern breakout is trade-worthy. Sometimes, even the flag pattern may generate false trading signals, and traders may end up placing the wrong trade.
- Flag patterns are not sufficient to make trade decisions. You need to combine it with other candlestick patterns or technical analysis indicators for effective results.
Conclusion
Flags are valuable technical analysis tools that can assist you in planning your trades. The best part is that they appear frequently on the trading chart, so you can identify multiple profitable opportunities.
Like any other pattern, flag trading patterns have some disadvantages. However, dealing with these drawbacks is easy when you have an in-depth understanding of trading flags.
Also, even after gaining knowledge, if you are struggling to identify trading opportunities, we can help you with that. At Carlos and Company, we provide comprehensive trading signals based on different technical analysis concepts and indicators. Reach out to try our demo trading alerts.