Day Trading Patterns: Master Candlesticks Trading
The entire day trading strategy is based on technical analysis, and the entire technical analysis is based on chart patterns. Knowledge of day trading patterns is a must to become an intraday trader.
There are numerous candlestick patterns in technical analysis. But not all are important for day traders. So, in this blog, we will study candlestick patterns considering the day trading strategy.
Day Trading and Technical Analysis
Day trading is a strategy for trading in financial products such as forex, commodities, stocks, indices, comex, and others. Under this, traders open and close a trading position within the day trading hours.
Day traders avoid holding positions overnight and aim for a quick profit. They generally organize technical analysis to identify the buy and sell opportunities.
In technical analysis, the price of the asset is represented by a chart in the form of a candle. These candlesticks form different structures on the chart to replicate price movements.

They can provide valuable trading insights regarding the asset’s future price movements. Thus, day traders monitor trading charts and identify and interpret these patterns to make the right trade decisions.
Here's a quick look at what you'll read
The best style for day trading is scalping or momentum trading. These are based on fast trades, little profits, and rapid decision-making based on market trends and price movements.
The candlestick chart is the best chart for day trading. It displays price movements clearly and makes it easy for traders to identify trends, patterns, and entry or exit points.
To gain trading patterns, begin with books, online courses, and videos. Use demo accounts and study charts every day to learn how patterns are formed and how they work.
The 1% rule means that you risk only 1% of your trading capital on a single trade. It helps to protect your money and to use losses wisely.
Day Trading Pattern for Beginners
Want to start day trading? Don’t be in a hurry. First, learn about the most essential charting patterns for day traders. Our day trading patterns cheat sheet below will help you generate potential day trading signals and execute trades accordingly:
Head and Shoulders
The patterns form a human head and shoulder-like structure on the chart during an uptrend. Thus, it is known as the head and shoulders. It consists of three peaks: the right and left peaks (shoulders) are similar in size, while the middle (head) is higher.
It also has a neckline that connects the troughs of the peaks. The pattern is confirmed when the price breaks the support (neckline). It suggests a reversal from an uptrend to a downtrend, indicating day traders open a sell position.
Inverse Head and Shoulders
The inverse head and shoulders is the opposite of the head and shoulders. Instead of three peaks, it consists of three troughs of similar nature to the H & S pattern. It occurs during the downtrend and is complete with the break of the resistance. It indicates a reversal from a downtrend to an uptrend and suggests traders open a buy position.
Ascending Triangles
Ascending triangles consist of two lines: the first one is the horizontal line that acts as a resistance, while the second one is the rising trend line.
The ascending triangle forms when the highs of assets are the same, but the lows keep rising. It occurs during an uptrend and suggests a trend continuation.
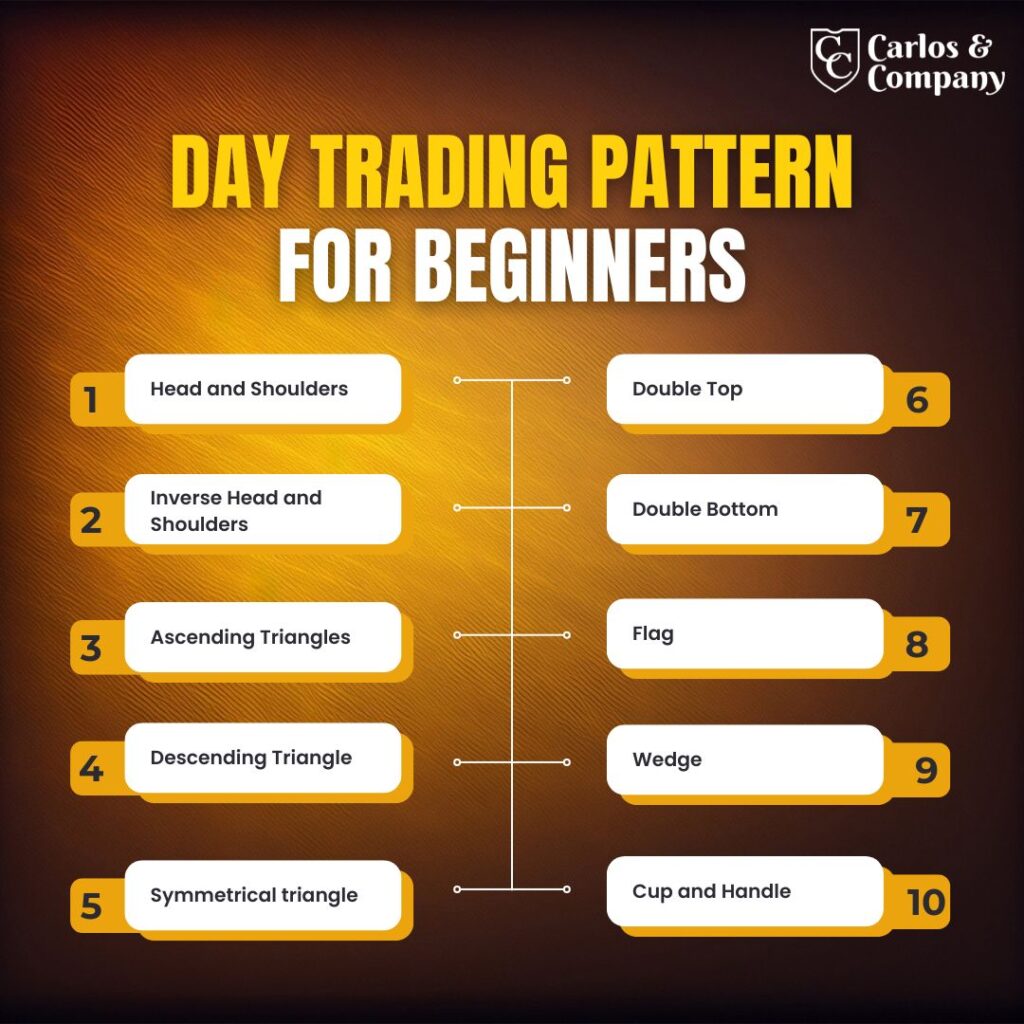
Descending Triangle
Descending triangles also consist of two lines. The first line connects the high of the asset that keeps falling. Meanwhile, the second line connects the asset lows, which are gradually the same. It occurs during a downtrend and also suggests a trend continuation.
Symmetrical triangle
A symmetrical triangle is a candlestick pattern that forms during the period of indecision in the market. It consists of two lines; the resistance line forms a downtrend, while the support line forms an uptrend.
Both the lines move toward each other, and the asset price moves in a consolidated range. The price breakout suggests potential movements to traders. When the price breaks the upper line, it suggests bullish opportunities; when the price breaks the lower trend line, it suggests bearish opportunities.
Double Top
The day trading pattern forms M shape structure on a chart. It has two peaks of similar heights and one trough. It is a bearish reversal pattern and confirms with the support line breakout. It indicates day traders that prices are expected to fall, and they can consider selling the asset.
Double Bottom
Double Bottom is a bullish reversal pattern that forms a structure similar to a W on the chart. It has two troughs of similar lows and one peak. The pattern completes with the resistance line breakout. It indicates day traders that prices are expected to rise, and they can consider buying the asset.
Flag
The flag is among the most popular day trading patterns in the forex market. A flag pattern forms either a bullish or bearish rectangular slope on the chart. It forms during the period of consolidation and suggests a trend continuation in the breakout direction.
A bullish flag forms when the two falling support and resistance lines occur. When the price breaks the resistance, it indicates the start of an upward trend.
A bullish flag forms when the two rising support and resistance lines occur. When the price breaks the support, it indicates the start of a downward trend.
Wedge
Wege also consists of two trend lines moving in the same direction. However, the one line is steeper, which results in convergence.
A rising wedge consists of two rising trend lines that connect higher highs and lower highs. It suggests a reversal from an uptrend to a downtrend when the price breaks the support.
A falling wedge consists of two falling trend lines that connect lower highs and lower lows. It suggests a reversal from a downtrend to an uptrend when the price breaks the resistance.
Cup and Handle
As the name suggests, it has a similar structure to the cup and handle shape on the trading chart. The pattern forms a ‘U’ structure followed by a handle consisting of two falling parallel trend lines. When the price breaks the upper trendline, it is expected to rise further, giving a bullish signal.
Inverse Cup and Handle
The inverse cup and handle consists of an inverted U followed by a handle. The handle has two rising parallel lines. When the price breaks the lower trendline, it is expected to fall further, giving a bearish signal.
Bottom Line
Day trading patterns serve as an ultimate guide to intraday traders. They can identify opportunities, manage risk, find trade entries and exits, and enhance overall trade executions.
However, these patterns can also generate false signals. Thus, making trade decisions based solely on one pattern is not a great idea. As a day trading patterns rule, you should combine these patterns with technical analysis to make effective trade decisions.
Also, the candlestick formation is quite complex to understand, and a detailed understanding is important. So if you are looking for chart pattern pdfs, click on day trading patterns pdf free download.
If you don’t have time to watch charts and identify opportunities, you can seek our help. We at Carlos and Company provide expertly designed day trading signals in diverse markets. Reach out to get demo trading signals.