How to Trade with Pivot Points: Key Levels for Market Reversals
Learn how to trade with pivot points using pivot trading charts. Discover key levels, strategies, and tips to improve your market analysis and profitability.
Floor Pivots
Traders believe the market direction can be divulged by Floor Pivot levels. They buy or sell these pivot levels and exit at either the first or second resistance levels. They also have the option to sell the pivot level and cover at the first or second support levels. Floor pivot trading is an effective way to find support and resistance levels, and is widely used by many traders. Prices around pivot levels signal choppy or trend market modes. In bullish markets, when prices consolidate around the pivot levels, prices tend to pick the prior trend direction and trade higher. Pivot trading is very crucial and most traders utilize daily Pivots for trading. However, weekly and monthly Pivots are equally important. Some traders compute the mid points between the Pivot and support or resistance levels and plot them on their charts.
A confluence of pivots increases the chance of potential support/resistance compared to a single pivot level. Often there will be many confluences between daily and weekly pivots on a chart and these levels could be significant for traders.
It is almost rare to see price reaching beyond R3, R4 or S3 and S4 levels on regular daily trading. Also, it may

be rare to see prices outside of weekly S2 and R2 levels. Some traders use weekly extreme levels and short weekly “R2” level and cover at the weekly Pivot or buy the weekly “S2” level and sell at weekly Pivot levels.
Pivots are very efficient for both day and swing trading. Pivot trading is quite profitable using these supportfresistance levels in the direction of the trend along with good money management techniques.
Floor Pivot Calculations

Trading Floor Trader Pivots
The example above illustrates Pivot levels from the ER2 15m chart. On February 8th, the market traded in a narrow range around the Pivot level suggesting a contraction in the volatility. On the following day, ER2 opened above the previous close and traded near the previous day’s high but could not hold on to this high prices. After the first hour, prices traded below the Pivot level at 8 17.8 suggesting a potential volatilitylrange expansion. ER2 continued to trade below the Pivot point, but above the key support level S 1 until lunch time. At around 12:30p.m., ER2 broke through the key
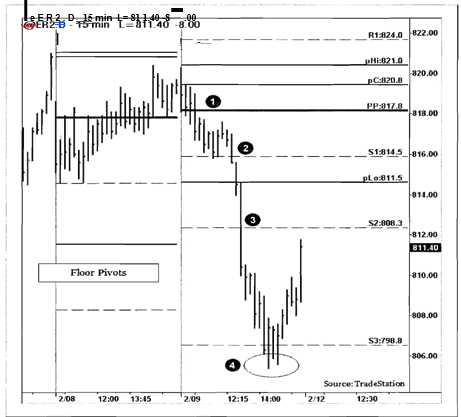
support level S 1 at 8 14.5. A “short” trade was entered below the S 1 level. The potential targets were the previous day’s low at S2 levels. The volatility expansion was very strong as the market fell through S2 at 808.3 level suggesting a potential target S3 at 798. At around 2pm, the market stabilized at S3 level and attempted a rally back towards S2 level.
Trading Floor Pivots
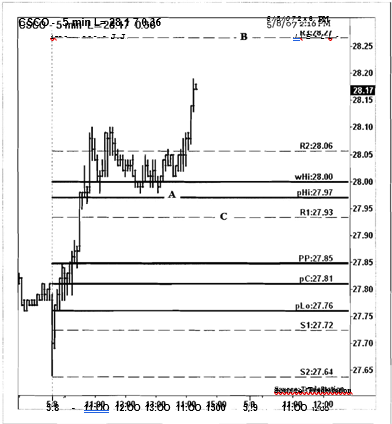
The chart above shows Floor Pivots from the Cisco (CSCO) 5 minute chart. On May 8th, in anticipation of CSCO’s earnings report, the company rallied above the pivot level. A trade setup was presented when CSCO traded above the weekly high, but below the second resistance at R2.CSCO prices traded above the previous day’s high at 27.97 and Pivot at 27.85 to suggest a potential bullish trend. At around 2 pm, CSCO closed above R2 to present a low-risk day trading opportunity.
- Enter a “long” trade 5 cents above resistance at
- Place a “stop” loss at the previous high (at $27.97).
- Place a “target” at the third resistance R3 (at $28.27).
Globex (Overnight) Pivots
Pit traders use Globex or overnight trading information extensively to determine key market trading levels for the current trading day. Globex trading hours start after the regular markets close and end before the regular markets open. For example, the Russell 2000 EMini futures on Chicago Mercantile Exchange (CME), the regular market hours are from 9:30 am ET to 4:15 pm ET. Globex trading hours for Russell 2000 futures starts at 4:30 pm ET and ends at 9:29 am ET. Similarly, the Dow Emini futures on Chicago Board of Trade (CBOT), has regular trading hours from 9:30 am ET to 5:00 pm ET. The Globex trading hours for Dow Emini futures are between 5:01 pm ET to 9:30 am ET.
Unlike floor pivots, most traders use only Globex High, Globex Low and Globex Pivot values. Globex High, Low and Close levels are used to compute the pivot price level. The Globex pivot value and the high and low levels are used for measuring market strength and weakness. During most trading days, the Globex pivots may be valid until noon as traders still remember the Globex high and low levels. They are very effective in the first hour of market open. Like regular pivot levels, Globex highs and Globex lows are used for resistance and support levels. The first hour test of these levels and reversals from Globex highs and Globex lows are significant in intra-day trading.
Globex Pivots
Pivot Point = (H+L+C)/3
Where,
H = High of Globex Range
L = Low of Globex Range
C = Close of Globex Range
Trading Globex Pivots
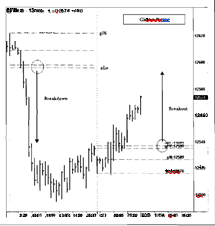
Globex pivots are for the overnight trading range. Globex pivot levels act as key resistance and support levels. They are mostly effective during the first few hours (until lunch hour) of trading. The example above shows the Russell Emini futures (ER2) from the 30 minute chart (24 hour chart). Globex high, low, Globex midpoint and Globex pivots are plotted on the chart. Arrows are placed on the chart to highlight the breakouts and breakdown from Globex high and low levels during the intra-day trading.

Opening Range Pivots
The Opening Range time is the initial time frame of trading for a stock or commodity at the start of each new trading session. For day-traders, this range could be the first 15 or 30 minutes and for swing or position trades it is the first hour range. Once this range is identified, the first hour pivots and support/resistance levels are calculated. This range usually sets the direction for the day and acts as important levels for intra-day trading.
Trading using the Opening Range pivot produces excellent results. In stronger markets, a long trade is initiated when prices pullback to the Opening Range pivot. A target for this trade is set at the first resistance. In weaker markets, prices crossing below the Opening Range pivot could signal a trend reversal and a short trade may be initiated.
Confluence of daily pivot levels and first hour Opening Range Pivots could be significant in trading. Most days, the first hour of highs and lows clearly signal the market’s strength. Trading below the pivot and the first hour lows set the market in a bearish mode. Similarly, trading above the first hour high and above the first hour pivot sets the market in a bullish mode. The advantage of using Opening Range pivots is market stability. In the first 30-60 minutes (the amateur hour) of the market open, prices go through a series of gyrations to settle on a market direction for the rest of the day. Most seasoned traders wait for prices to pick a clear market direction with the opening range (the first hour) data before start trading.

Trading Opening Range (First Hour)
The example above illustrates the Opening Range pivots from the ER2 5m chart. On January 19,2007, ER2 traded in a narrow range in the first hour-Opening Range (shaded area) from 778.7 to 78 1.9 and closed at 78 l.l(at marker 1). After the first hour of trading, ER2 set to trade above the Opening Range high at 78 1.9 and the Opening Range pivot at 780.6 signaling an upside day with range expansion.
1 . Enter a “long” trade above the first hour high at 78 1-9.
2. Place targets at R2 and R3 levels.
3. Place a “stop” order few ticks below the pivot at 780.6.
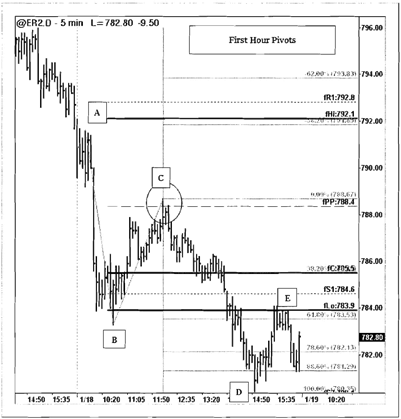
Trading Opening Range (First Hour) with ABC Pattern
The chart above shows Opening Range pivots along with an ABC pattern trade. On January 18,2007, ER2 opened at a high of 791.8 and drifted lower in the first hour to trade near 784 area. After the first hour of trading, ER2 attempted to rally to the first hour pivot at 788.4 to form an ABC pattern. The trend and market direction was weak as prices continued to trade below the first hour pivot and the first hour high. Prices attempted to rally, but around noon, ER2 could not close above the first hour pivot and reversed its direction to signal a potential short trade.
- Enter a “short” below the first hour pivot at 787.8.
- Place a “stop” order above the first hour pivot at 788.5.
- Place a target from 78.6% to 100% of AB range (from C) to 781.3.
Fibonacci Zone Pivots
John T. Jackson described a concept called “Zone Probability Pattern Analysis,” in his book Detecting High Profit Day Traders in the Futures Markets. In his book, he describes the dynamic statistical analysis of “Fibonacci Zones” using Open, High and Close to find high percentage support and resistance zones for the entire trading day.
Robert Krausz has completed extensive analysis on “High Probability of the Fibonacci Zones” (HPFZ) concept by using “Probability Matrix.” Krausz used various close and open combinations as price moves from zone to zone to achieve the highest probable Open to Low combination for the day.
In this chapter, I present how I use Fibonacci Zone Pivots for my trading. I use HPFZ zone concept as boundaries for trading key support and resistance areas. For additional analysis, please read J.T. Jacksons’ book on Zone Pattern Probability Analysis (See References)
Computing FibZone pivot starts with calculating the pivot (High+Low+Close)/3 for the current day and then projecting the “zone pivots” for next day. Adding daily range and its multiples to this pivot point gives various potential resistance and support levels. The boundaries of these resistance/support levels are marked as FibZones. An extensive study has been done on the relationship between yesterday’s close and today’s open within these zones to find a potential daily “close” for the current day. I use FibZones in my personal trading and have found them to be valid and useful. My usage of HPFZ is limited to finding intra day resistance and support areas and not for the zone analysis.
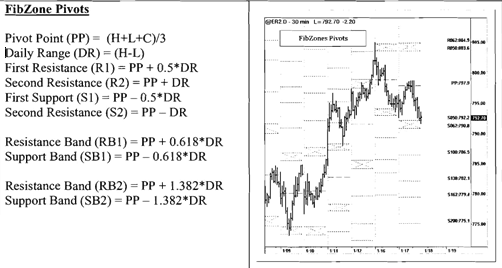
Trading FibZone Pivots
The example above shows FibZone pivots plotted from the Russell Emini futures (ER2) 610 chart. Fibzones are plotted at the end of the day for the next trading day. On February 6th,ER2 sold-off and found support near the “support” band between the S50 to S62 range. In the afternoon, ER2 rallied back from “support band” (A) and closed in the “resistance band” (B). The following day, ER2 had a brief sell-off to the pivot point (C) and rallied to the “resistance” band (D). The first test of resistance to the rally came in the afternoon at 100% of range test E. A pullback to the “resistance” band-R50 to R62 is expected after the morning rally to (F). Another continuation of the rally, sent prices to 138% of previous day range above pivot level (G).